
Data Normalization and Setting Aliases
Topics Covered:
Introduction to Data Normalization: The importance of understanding data normalization to improve data consistency and reduce redundancy.
Creating a Data Source: How to create a custom data source for your dashboard by selecting relevant tables.
Setting Aliases: The process of assigning clear aliases to tables and columns for easier reference and to ensure consistency across different data sources.
Sorting Data: Organizing the data by sorting it alphabetically for clearer presentation.
Selecting Columns: Best practices for selecting only the necessary columns.
Data normalization
Before we move forward, it’s important to understand the concept of data normalization. We recommend reading this Microsoft article on Database Normalization(opens in a new tab) to get a solid grasp of the idea.
To put it simply, imagine your data as an Excel sheet with thousands of records for cards. Some of the columns in this sheet may contain repetitive data. For example, if many cards share the same category, like "Work," and you want to change the category name, you would have to update it everywhere.
Data normalization helps solve this problem by making the data more consistent. Instead of having the category name repeated in every record, we create a separate sheet for categories, assign an ID to each category, and then use the category ID in the card records. This reduces redundancy and also makes the data more efficient in terms of storage.
Now that we have the concept clear, let’s move on to the steps:
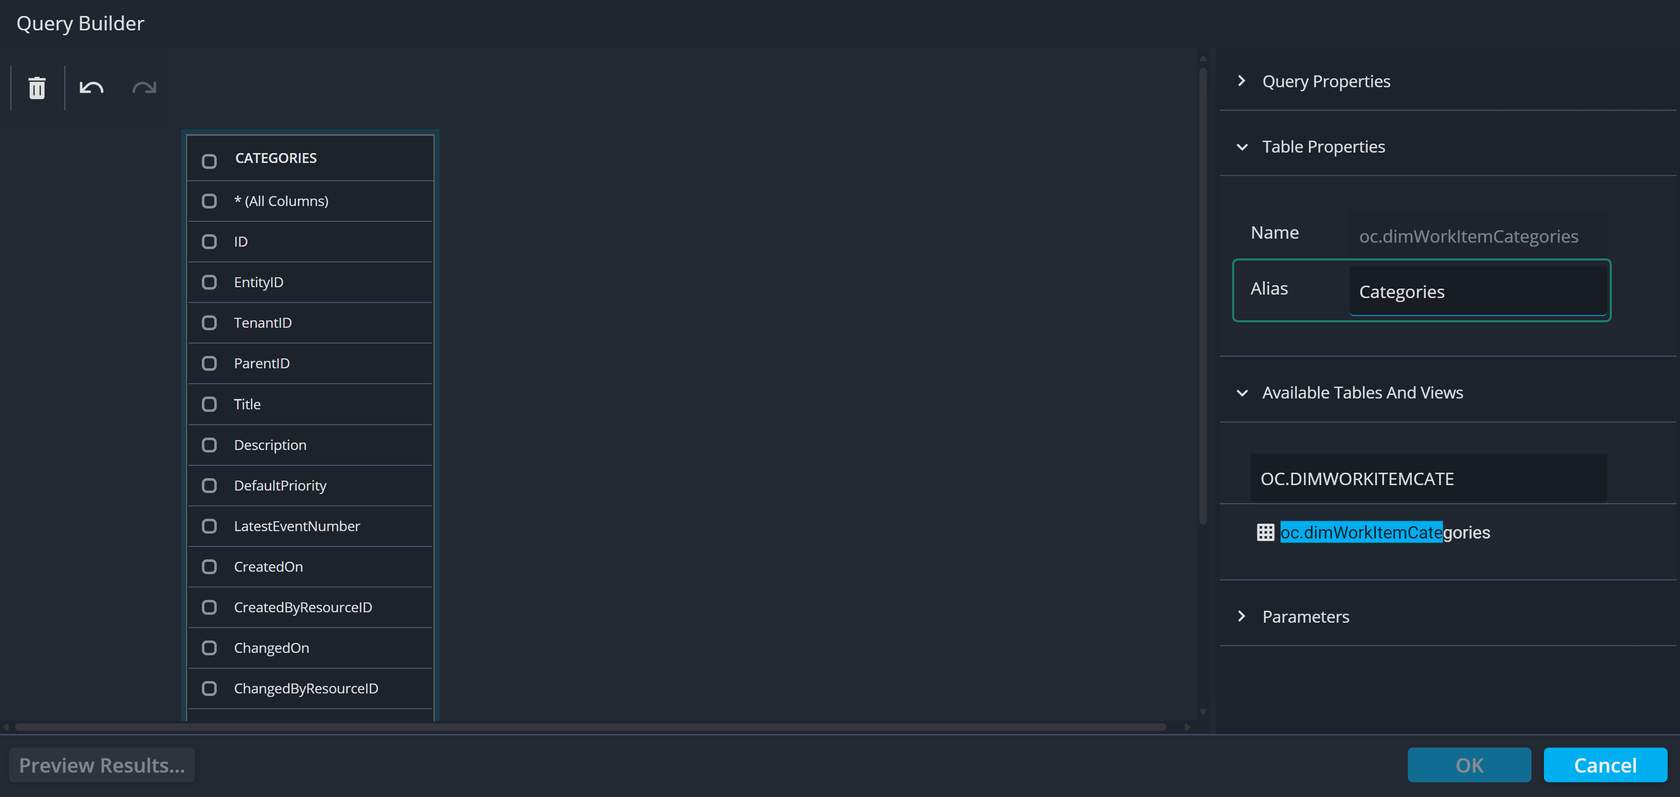
1. Drag the OC.DIMWORKITEMCATEGORIES inside the query builder.
2. Click on the header of the OC.DIMWORKITEMCATEGORIES table to open the Table Properties section in the side panel.
Set Aliases for Better Data Management
When working with data, aliases are essential for simplifying and organizing your tables and columns. An alias is just a display name that makes it easier to refer to a table or column without needing to use the full, often long, name. Setting aliases allows you to work more efficiently as you can reference them easily throughout the tutorial.
For example, instead of using the full table name, which could be something like OC.DIMWORKITEMS, you can set an alias like Categories. This helps keep things clear and concise, and you’ll be able to quickly find and refer to the table later.
The same concept applies to columns. If your data source contains multiple tables and some of them have a Title column, renaming it to something more specific like CategoryTitle helps avoid confusion. This way, you can use the column without ambiguity, and you won’t have to specify the table name each time.
Now, let's follow these steps:
1. Click on the header of the OC.DIMWORKITEMCATEGORIES table to select it, then set the alias to Categories.
2. Check the ID field and set its alias to CategoryId
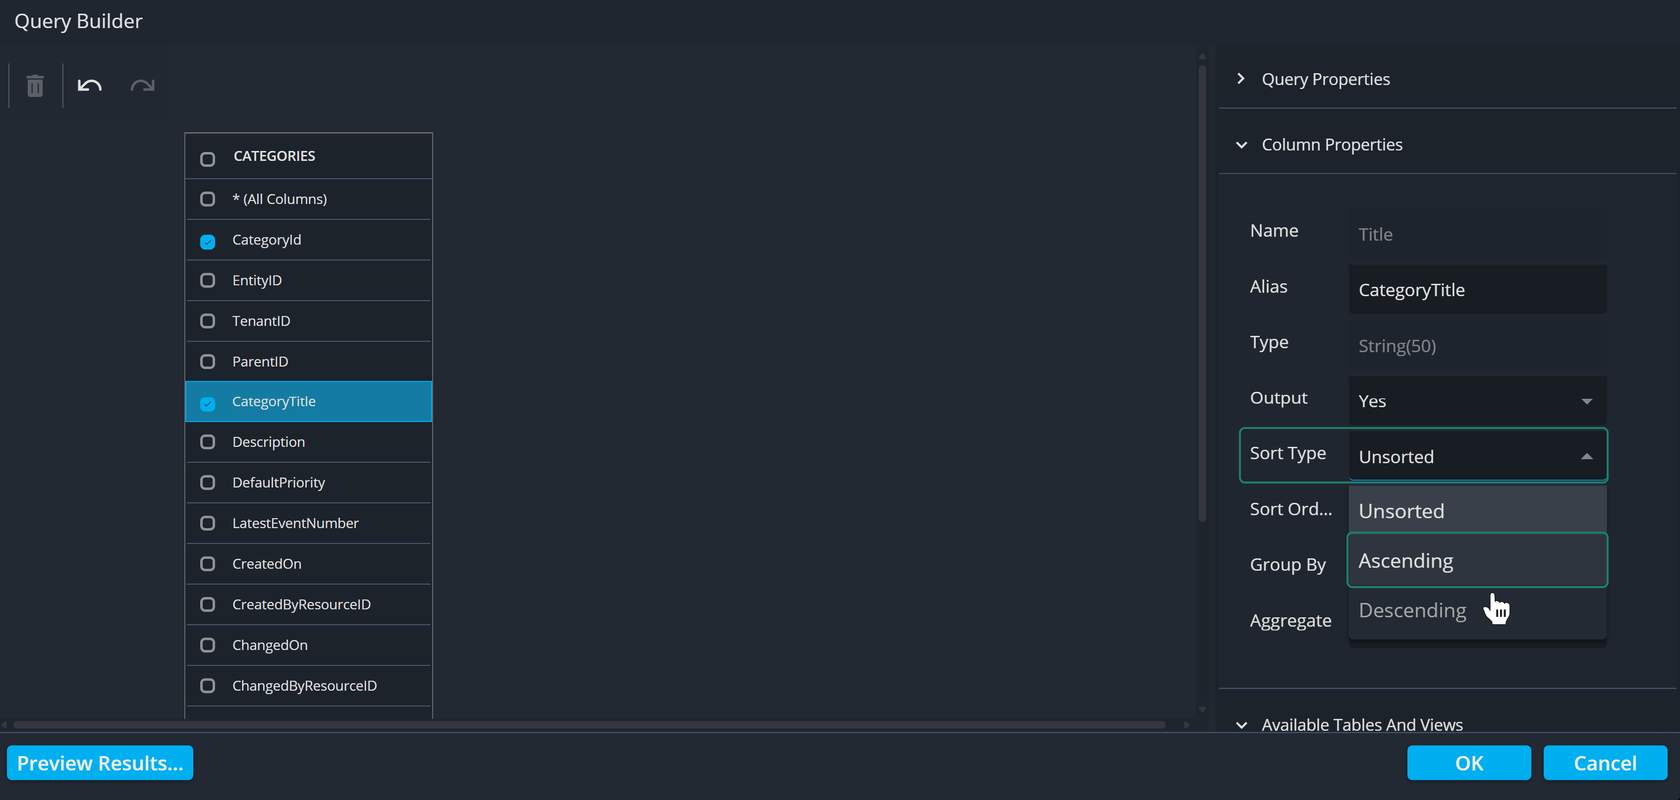
3. Check the Title field and set its alias to CategoryTitle
4. Set the Sort Type for the CategoryTitle field to Ascending.
💡 Important note
If you set an alias for a table or column, it’s important to keep it consistent across different data sources that you may add later. This consistency is necessary for the cross-widget filter to work properly, as it relies on matching aliases between data sources.
Recap of What We’ve Done So Far:
To create a widget, we first need data. We get this data from a data source, and in this case, we created a new data source. Here's what we've done so far:
- Created a New Data Source: We added a data source to the dashboard and selected the relevant table containing all the categories.
- Assigned Aliases: We set clear aliases for both the table and the columns to make future reference easier. For example, the table alias was set to Categories, and the column aliases were set to CategoryId and CategoryTitle.
- Sorted the Data: We set the data to be ordered by CategoryTitle alphabetically to ensure a clear and organized display.
- Selecting Columns: It's a best practice to only select the columns you need. This improves the loading speed of your dashboard.
For this dashboard, we only need the Id and CategoryTitle columns, so we’ll select just those. This approach will streamline your dashboard and make it more efficient as you move forward.