Start by creating a board
Steps to create a board in Operations Center.
Step 1. Select template
Start by creating a Dispatch board using Operations Center templates. This feature is available to System users and System admins. If you need to read about Operations Center roles and permission, click here.
Step 2. Configure your boards properties
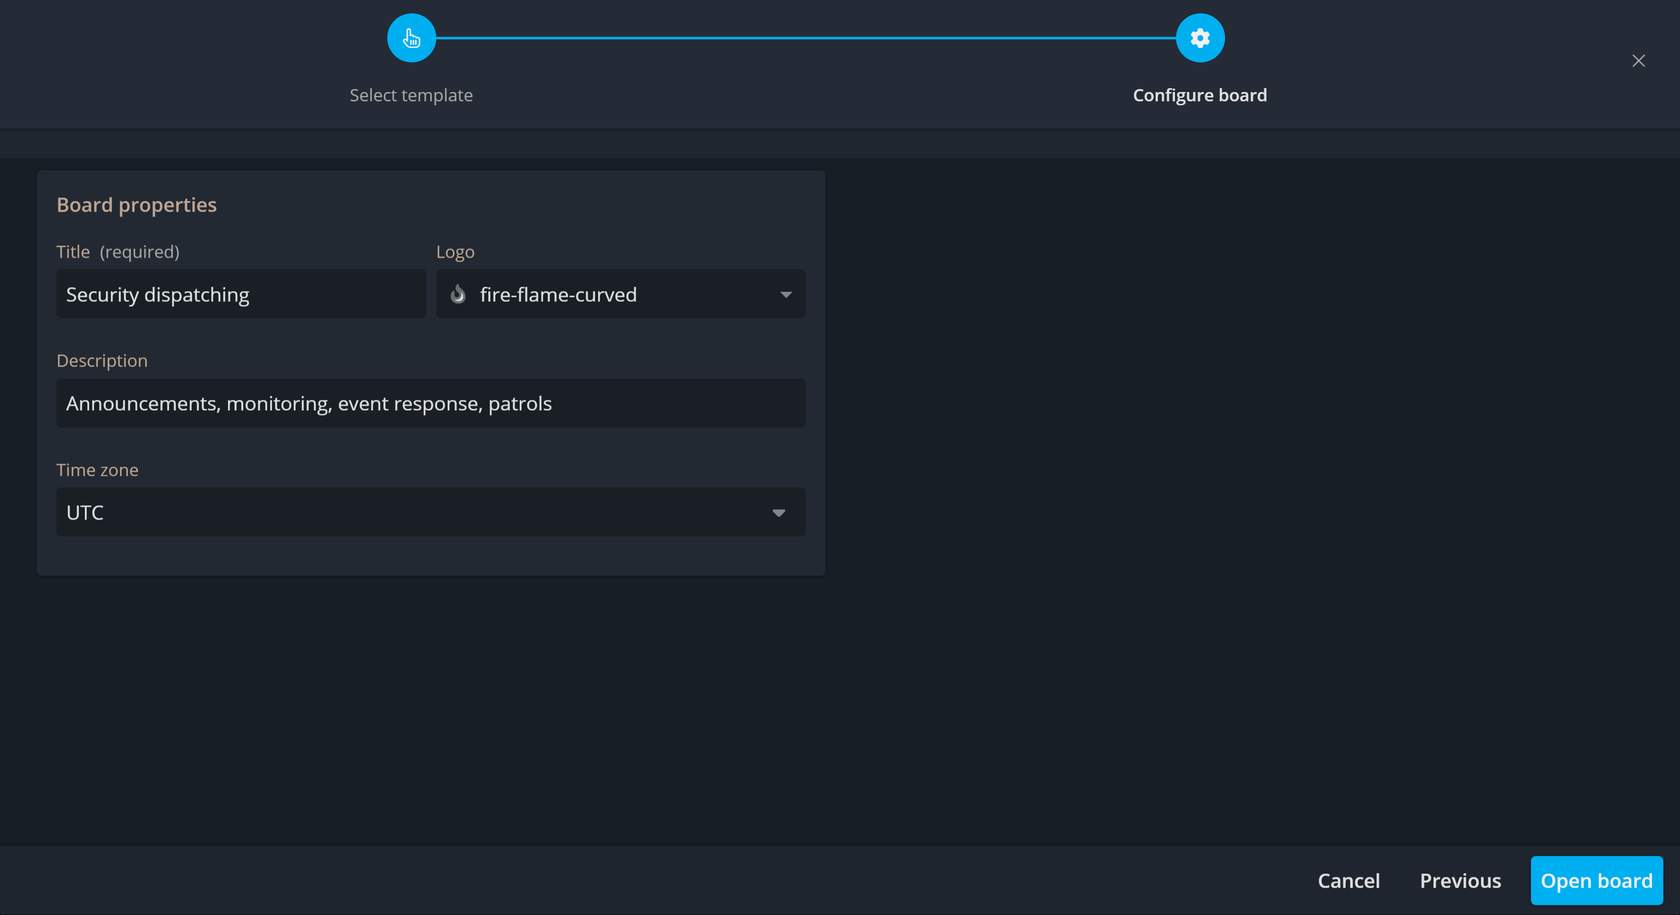
Add a title and select a logo for your board. Any additional information can be added inside the description box. select the right timezone for your team and click Open board.
Step 3. Add more cards to your board
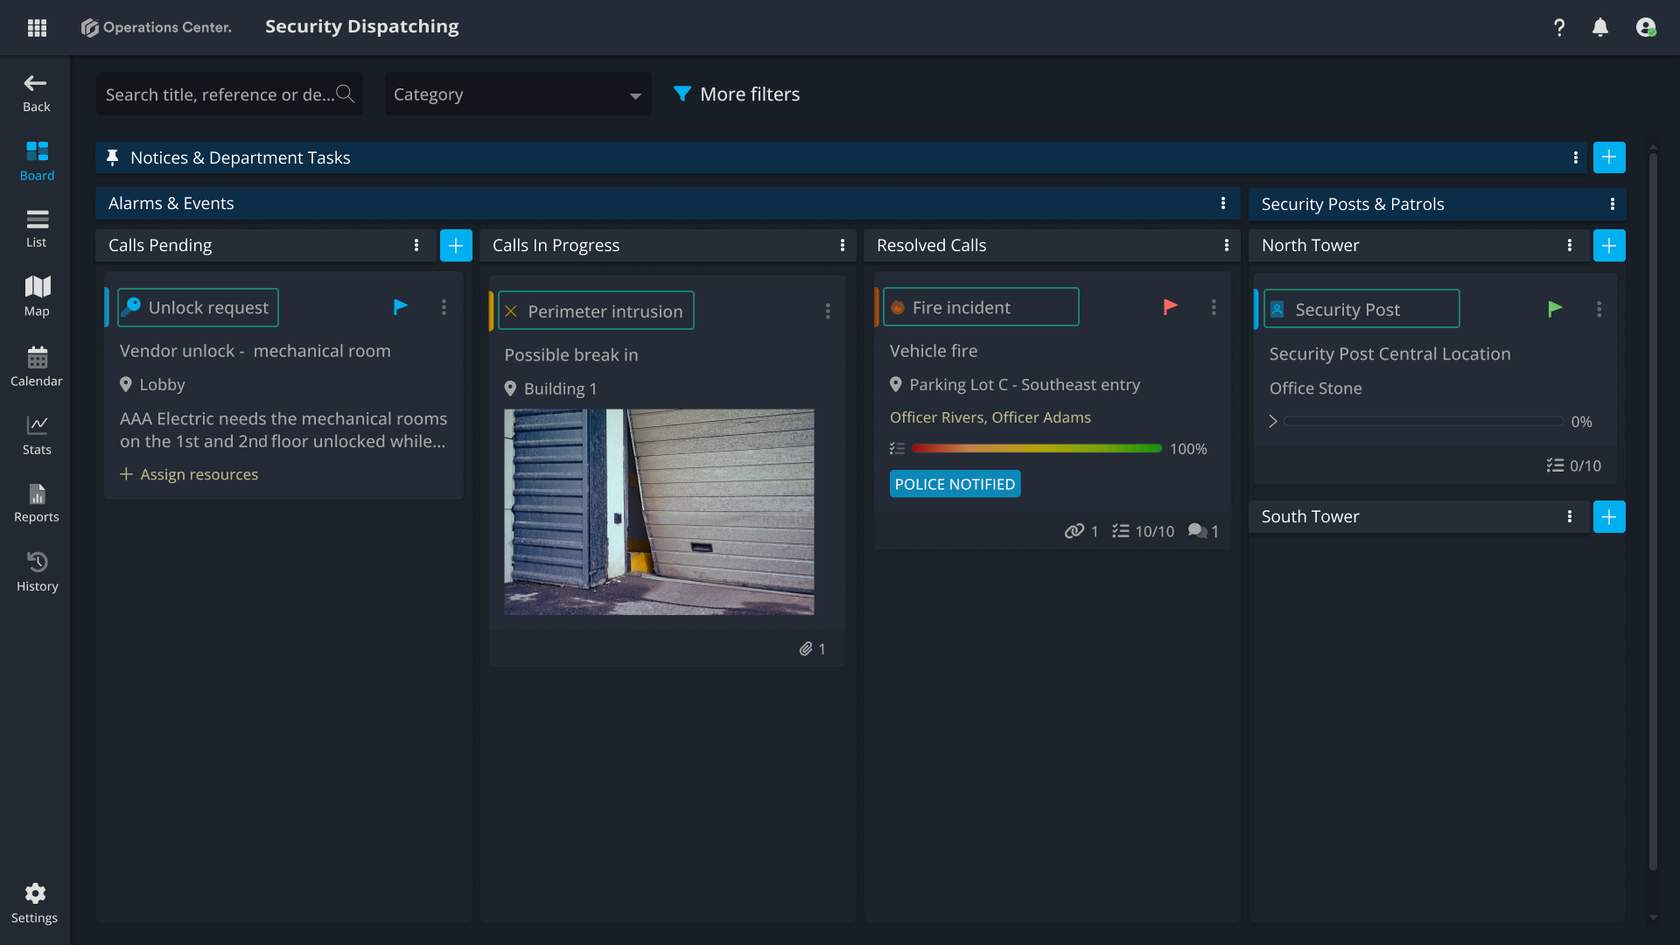
Explore the different categories available. In our example, we've assigned random priorities to the cards. Once you're happy with the cards you've added, you're ready to move on to the next step.
Open Stats
Operations Center aims to make managing your work as visual and intuitive as possible offering multiple views to help you organize, track, and analyze your tasks in the way that works best for you and your team. One of these views, Stats, is a great tool for gaining insights into your workflow. You can track your team's performance, monitor task completion speed, observe progress over time, and more.
A sample dashboard is available to help you get started. To view it, simply navigate to the Stats view. Inside, you'll find an overview of the cards created in the previous step.
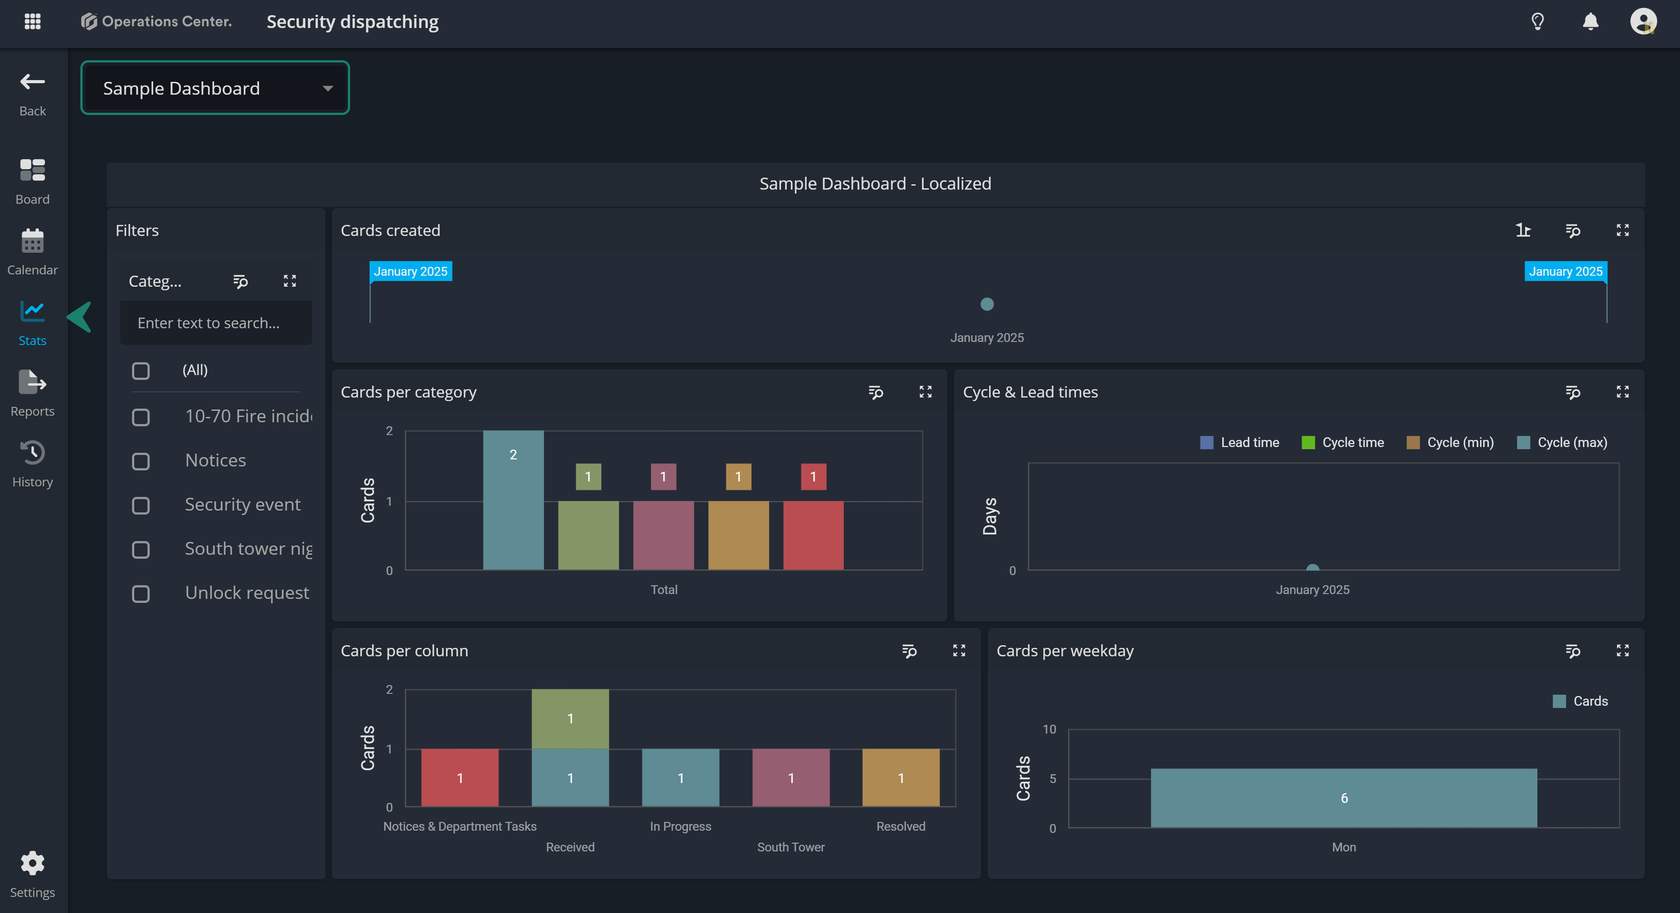
Dashboard widgets
The sample dashboard is divided into 5 widgets:
Cards created
The widget you see is a timeline, displaying all the cards created at the same time in our example. As a result, you’ll see a single data point. In more advanced boards with greater variety, you can select a specific date range to customize the view. Additionally, all widgets can be expanded to full screen for a better, more detailed view.

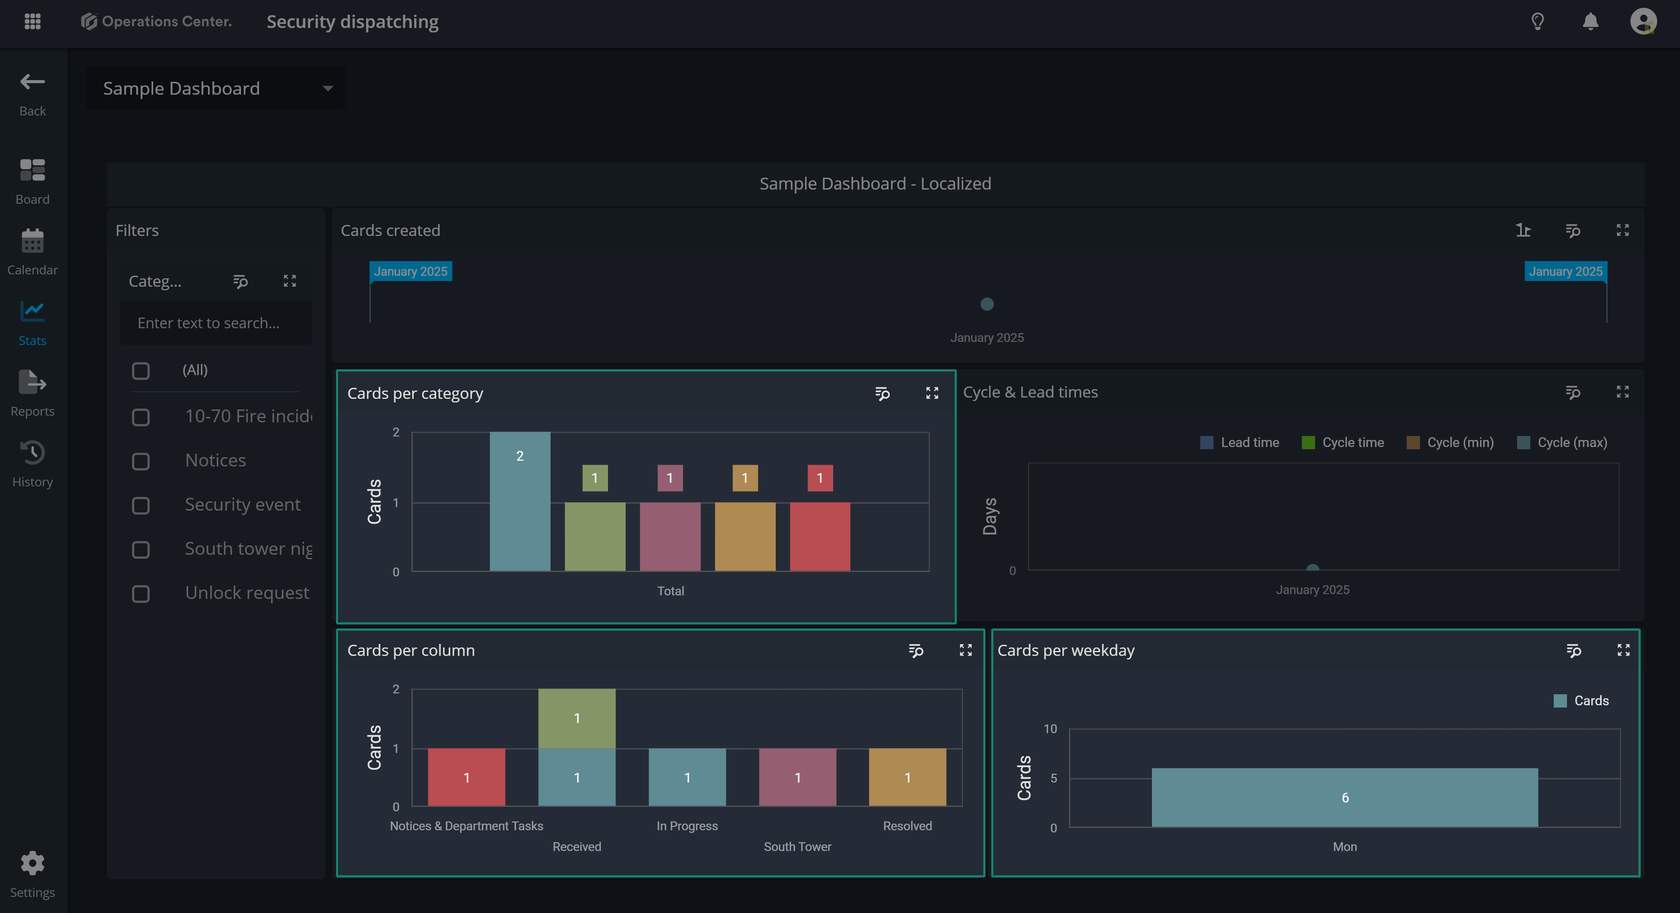
Cards per category, column, weekday
These two widgets are charts that display information about the cards you created, specifically their categories and the columns they are currently in.
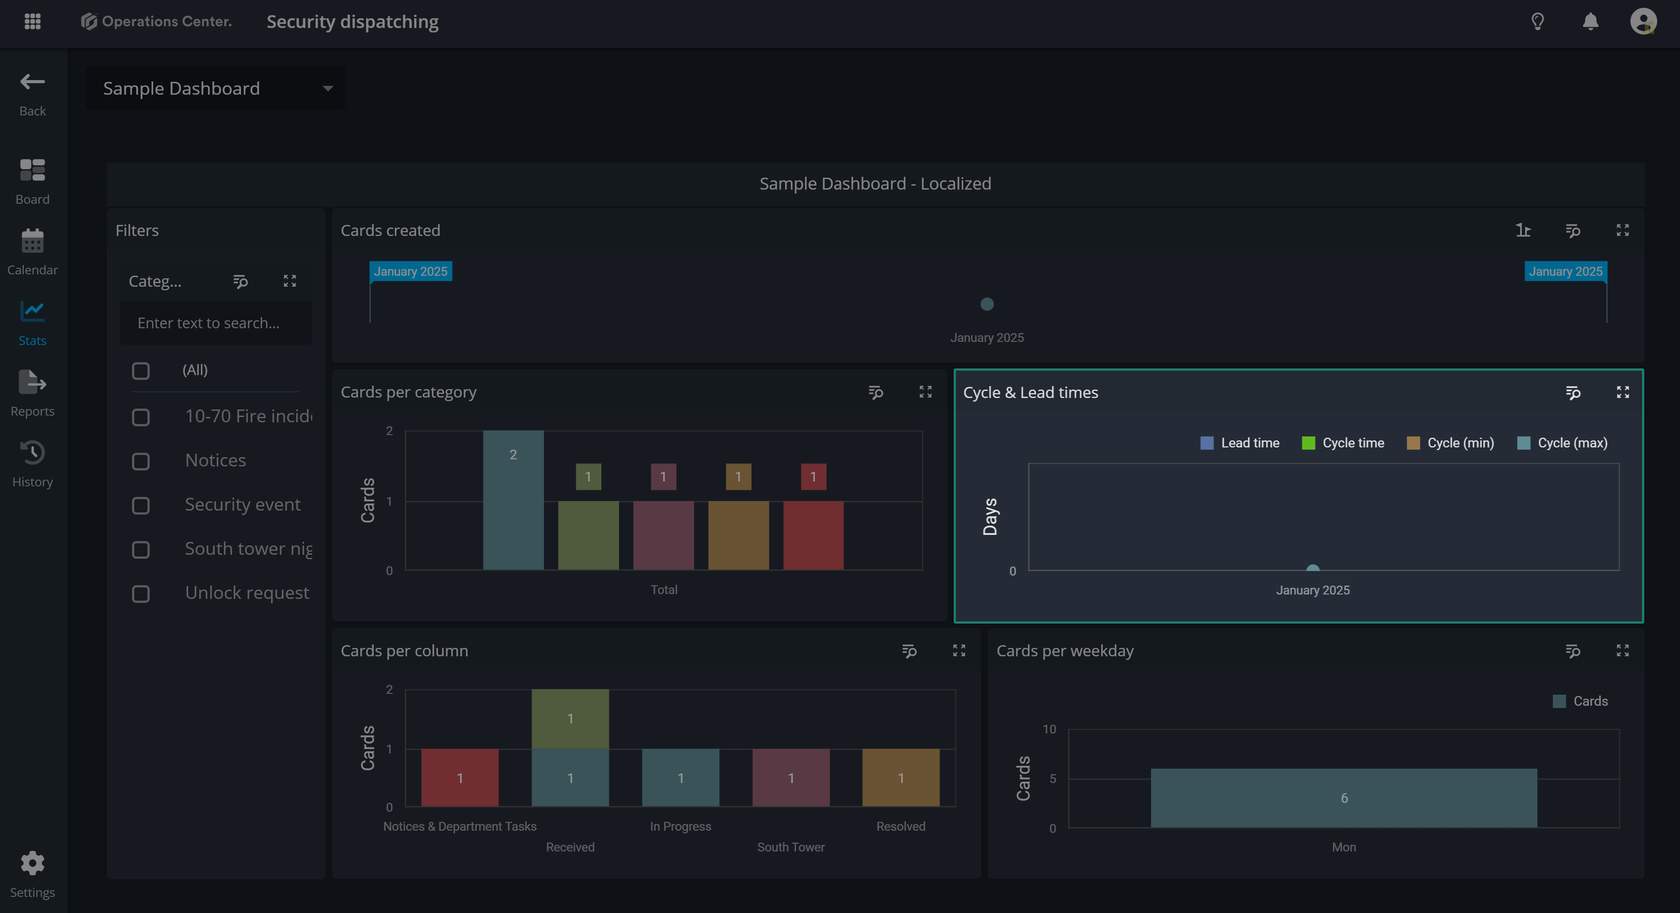
Cycle and lead time
The Cycle Time shows the time tasks spend in active phases of your process. The Lead Time tracks the total time from task creation to completion. These widgets help identify delays and measure workflow efficiency.
Dynamic Insights with Dashboards
The Filters section lets you narrow down the data displayed in the widgets by category. This is especially useful for busy boards, allowing you to view data more clearly for specific types of work.