Creating & Customizing Dashboard
Topics:
Creating a New Dashboard: Learn how to initiate a new dashboard tailored to your requirements.
Understanding Data Sources: Explore the two primary data sources—Data Source and Parameters—and how they contribute to your dashboard's functionality.
Setting Up a Custom Data Source: Step-by-step instructions on creating a custom data source for your dashboard.
The general dashboard provides an overview of key information for every board. However, it might not always include the specific details you need. In such cases, you have the flexibility to create a customized dashboard tailored to your unique requirements. This allows you to focus on the data that matters most to you.
Create dashboard

The create dashboard button is only visible to member with the Dashboard and Report administrator role. Click here (opens in a new tab)to learn how to assign roles to members.
Set a Title and Define Availability Scope

In the popup, give your dashboard a meaningful name. Next, select the Availability Scope for your dashboard.
For this example, we are selecting the Board scope.
Here’s a quick explanation of the two availability options:
- Board Scope: The dashboard is tied to a specific board and is available to all users who have access to that board.
- System Scope: The dashboard acts as a template across all boards in your system. While the widgets remain the same, the data displayed is specific to each individual board. This option is ideal if you want a consistent layout for dashboards while reflecting unique board data.
Data and Parameters in Your Dashboard
Now that we’ve created the dashboard, you’ll notice that it’s currently empty—there are no widgets yet. To create widgets, we first need data. Data for your dashboard comes in two forms:
1. From a Data Source
The data source is the primary source of information for your dashboard. It contains all the details related to your board, such as cards, tags, custom fields, and more.
2. From Parameters
Parameters are another way to bring data into your dashboard, and they can be incredibly powerful for creating dynamic and reusable dashboards. For example:
When you set the System scope in the previous step, the dashboard acts as a dynamic template. To display data specific to a particular board, parameters are used.
This is just one example of how parameters can enhance dashboards. For more information, you can explore the DevExpress Parameters Documentation.
Exploring Parameters
Click on the Designer button to open the dashboard designer. Next, click on the hamburger menu to access the parameter list. Here, you can see the parameters that were automatically added when you created the dashboard. These parameters will automatically be replaced with the correct values when a user views the dashboard.
You also have the option to create custom parameters, allowing end users to select specific options when viewing the dashboard. However, for this tutorial, we’ll work with the two parameters that are already in place.
Create a Custom Data Source
Now, let's move on to creating a custom data source for your newly created dashboard. We’ll ignore the default data source for this process.
To get started:
- From the menu, click on Data Sources. This will open the Data Sources page.
- Next, click on Add to add a new data source. This will open the Add Data Source popup.
- Click on Create Data Source... to open the Dashboard Data Source Wizard.
Setting Up a Data Source and Querying Categories
At this point, all your data is stored in a relational MSSQL database. The only available connection here is called Warehouse Connection—select it.
1. Data source type
Now you’re ready to set up your data source and move forward with creating a more personalized and dynamic dashboard. to do so, select Database as your data source type, and click Next.
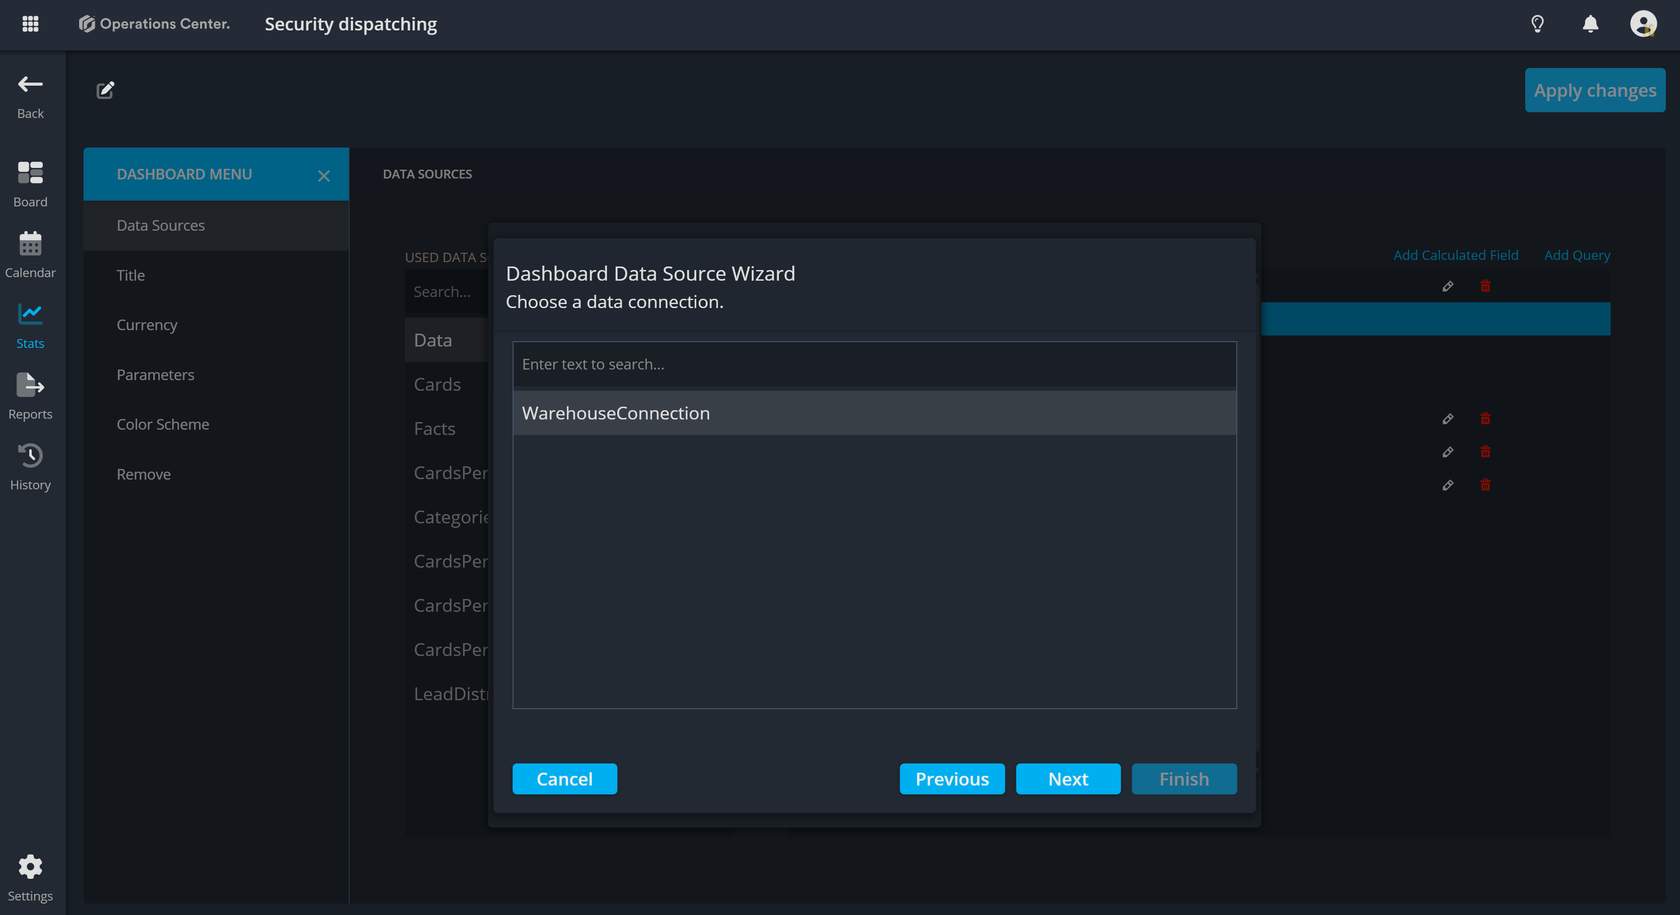
2. Data connection
Select the WarehouseConnection and then click on Next.
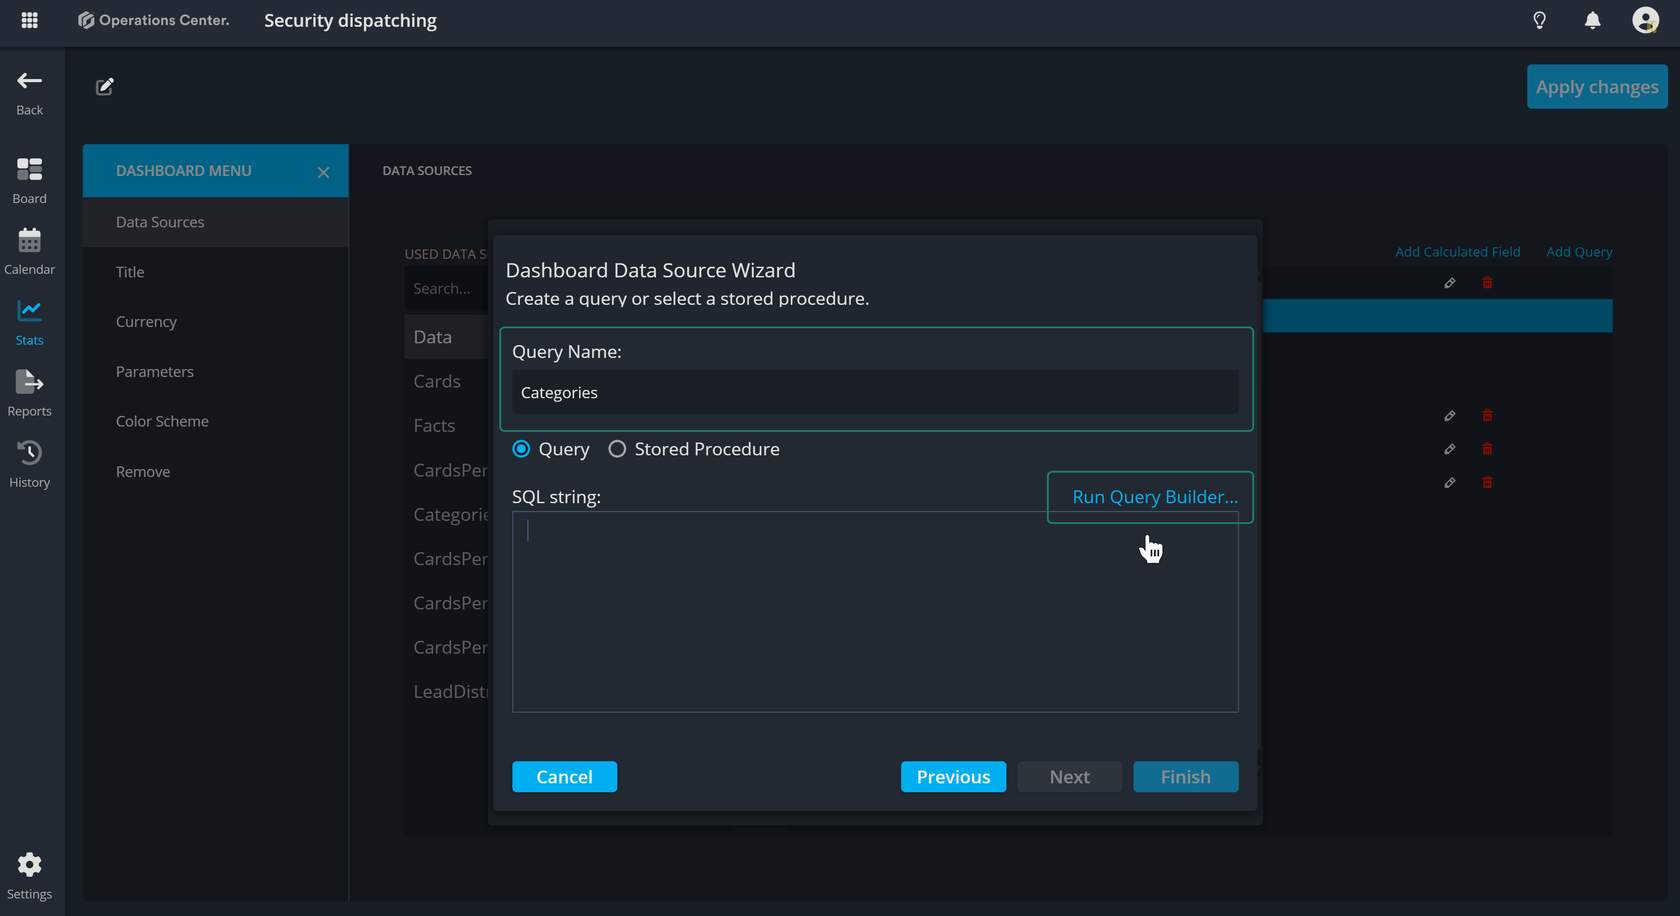
3. Create a query
We’ll start by creating a widget that shows the list of categories used in this board, which means we need a data source specifically for the categories.
To do this:
- Click on Run Query Builder... to open the Query Builder and begin crafting your first query.
- The Query Builder works the same way as it does in the reports section, so if you're familiar with that, this will feel very similar.
Now you can use the Query Builder to specify the data needed to display the list of categories in your widget. This is your first step in pulling in relevant data for your dashboard.