
Dashboards in Operations Center
Introduction
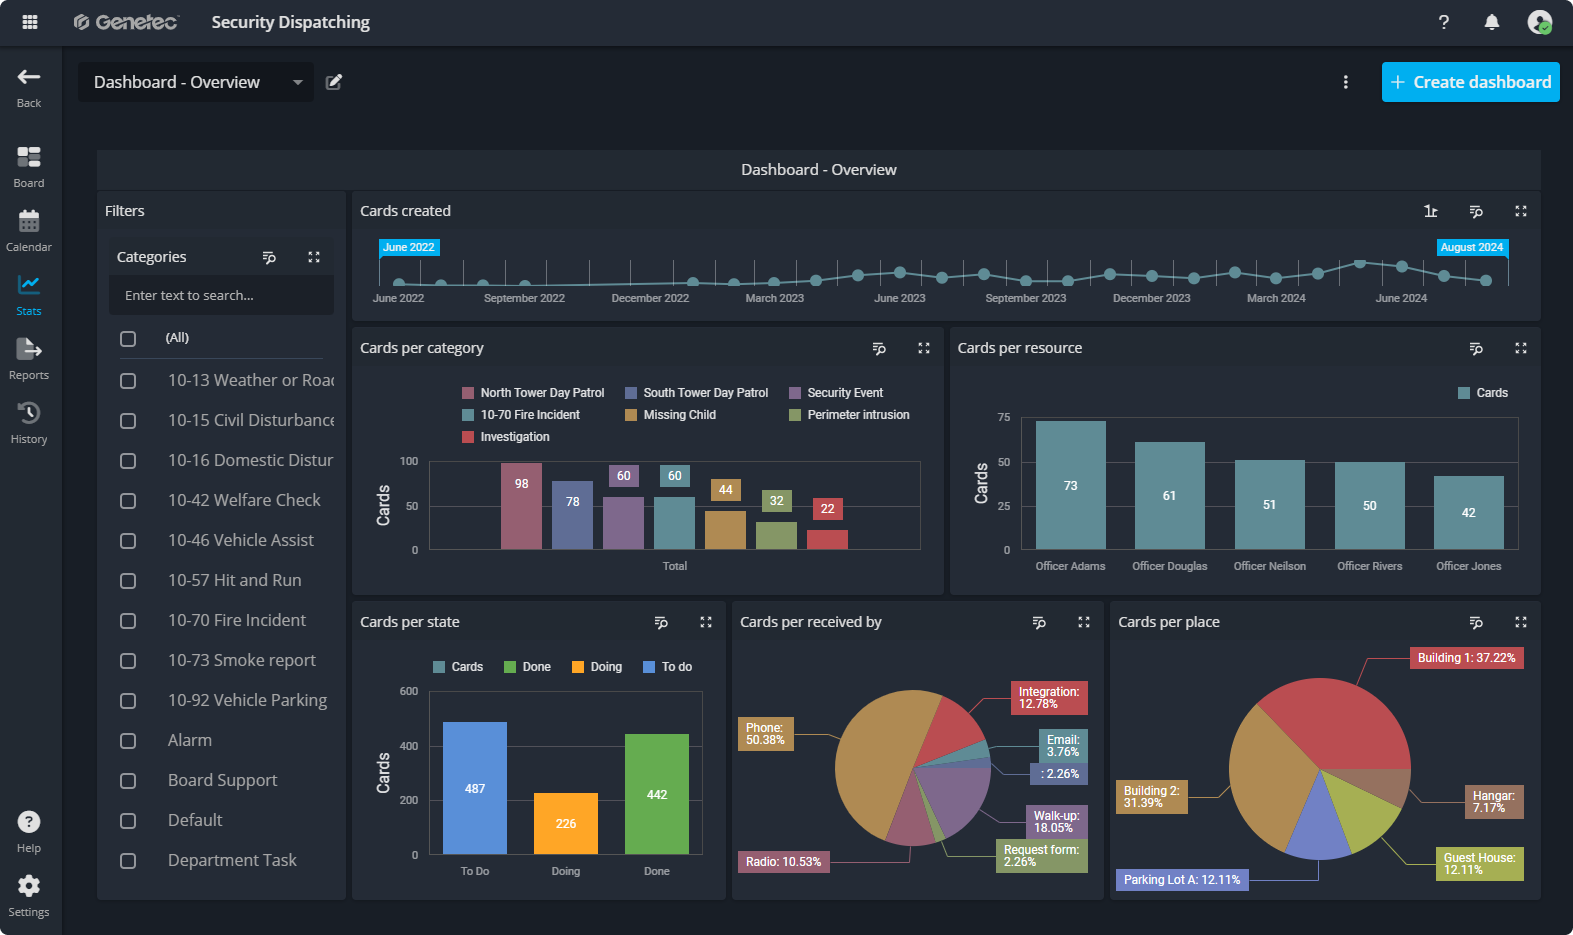
Stats view in Operations Center is a great way to get analytics about your workflow. Track your team's performance, monitor how quickly tasks are completed, observe their progress over time, and much more. The insights you can gather are limitless.
Who Can Create Dashboards?
Who Can Create Dashboards?Viewing pre-created dashboards is accessible to everyone. However, creating new dashboards requires some foundational knowledge of relational databases, such as MSSQL or PostgreSQL. To successfully design and manage dashboards, it’s important to understand:
- Concepts like foreign keys, indexes, and data grouping.
- How to query data from relational databases using T-SQL.
While most of the creation process is handled through a graphical user interface (GUI) using DevExpress Dashboard, having a basic understanding of the underlying SQL queries is essential. The actions you perform in the GUI often translate into specific queries, so knowing what’s happening behind the scenes will help you work more effectively.
To brush up on SQL concepts, we recommend exploring W3Schools SQL Tutorial. Additionally, if you encounter challenges while designing your dashboard, the DevExpress Documentation provides in-depth guidance on using the tools and components effectively.
follow the next article to start creating a new dashboard.