Adding data to your report
Now that the basic settings for your report are configured—page size, margins, fonts, and behavior—it’s time to add data. This is where your report starts to come to life. You’ll be able to display, filter, and analyze information from your board so that the report provides meaningful insights.
Think of this as giving your report its “content backbone.” Everything you add here will automatically follow the defaults you set earlier, keeping your report consistent and easy to read.
Adding a data source
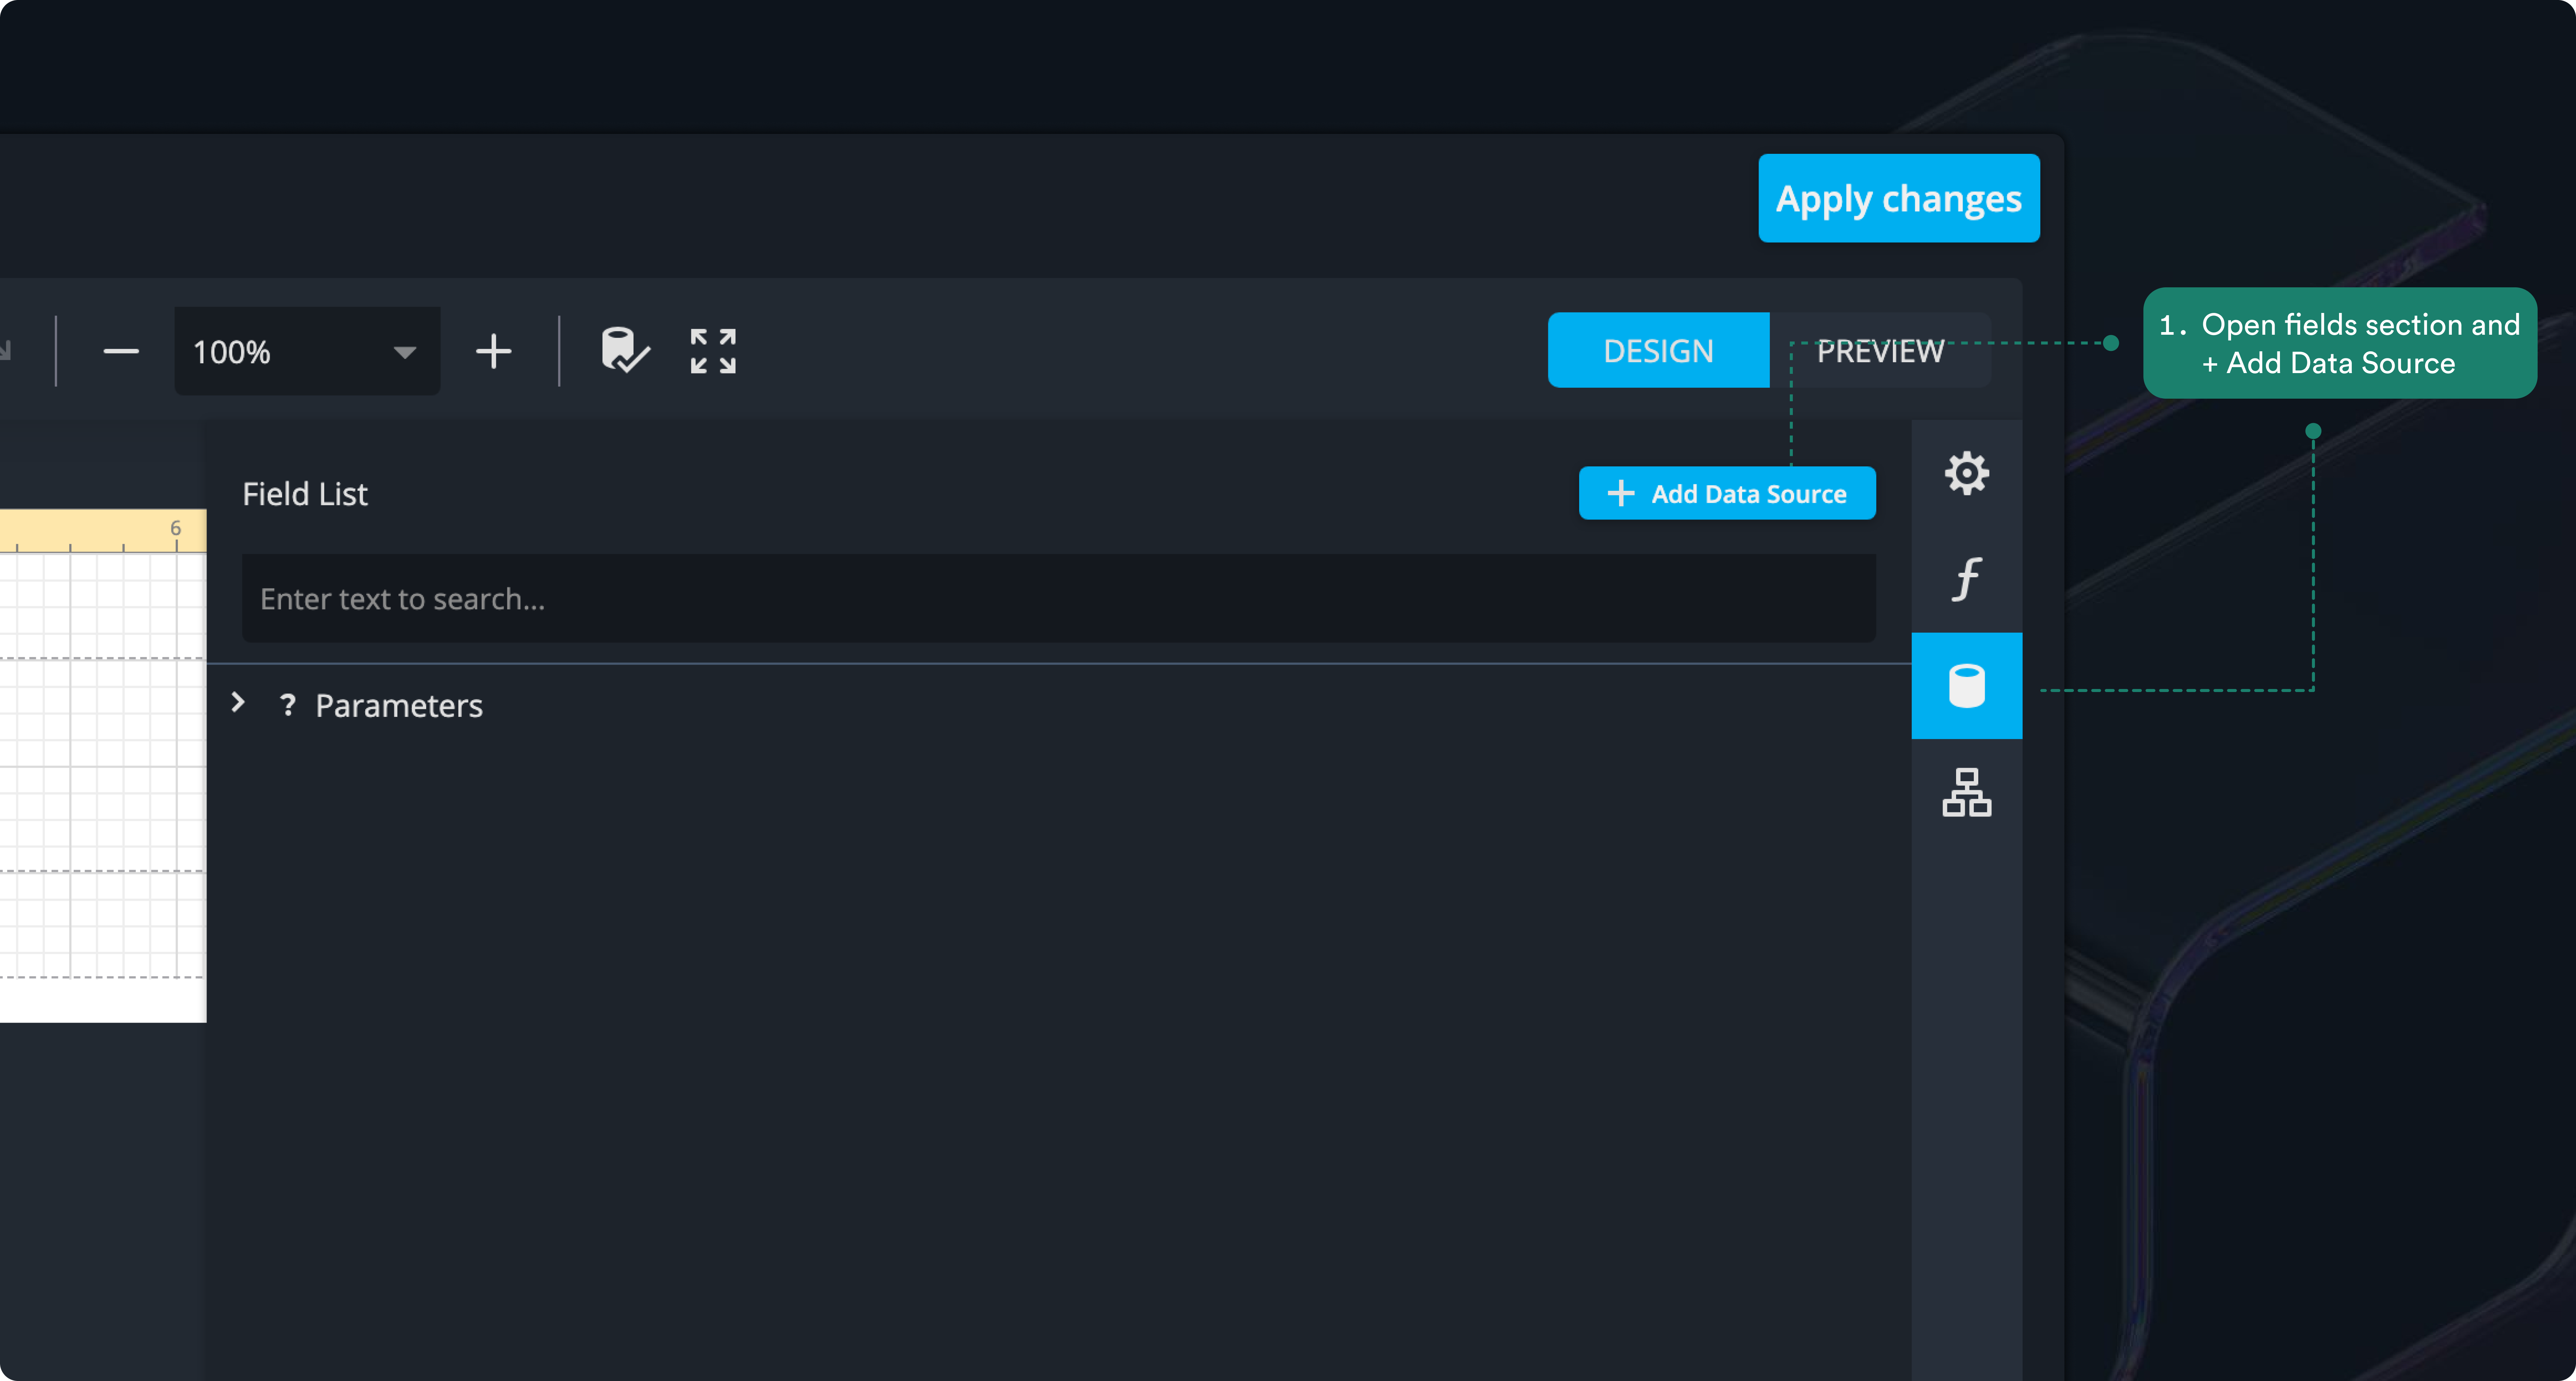
1. In the right navigation bar, click Fields, then select Add Data Source.
2. This opens a wizard. On the right side of the wizard, you can search and select the tables, views, or stored procedures to include in your report. Search for oc.dimboards and select it.
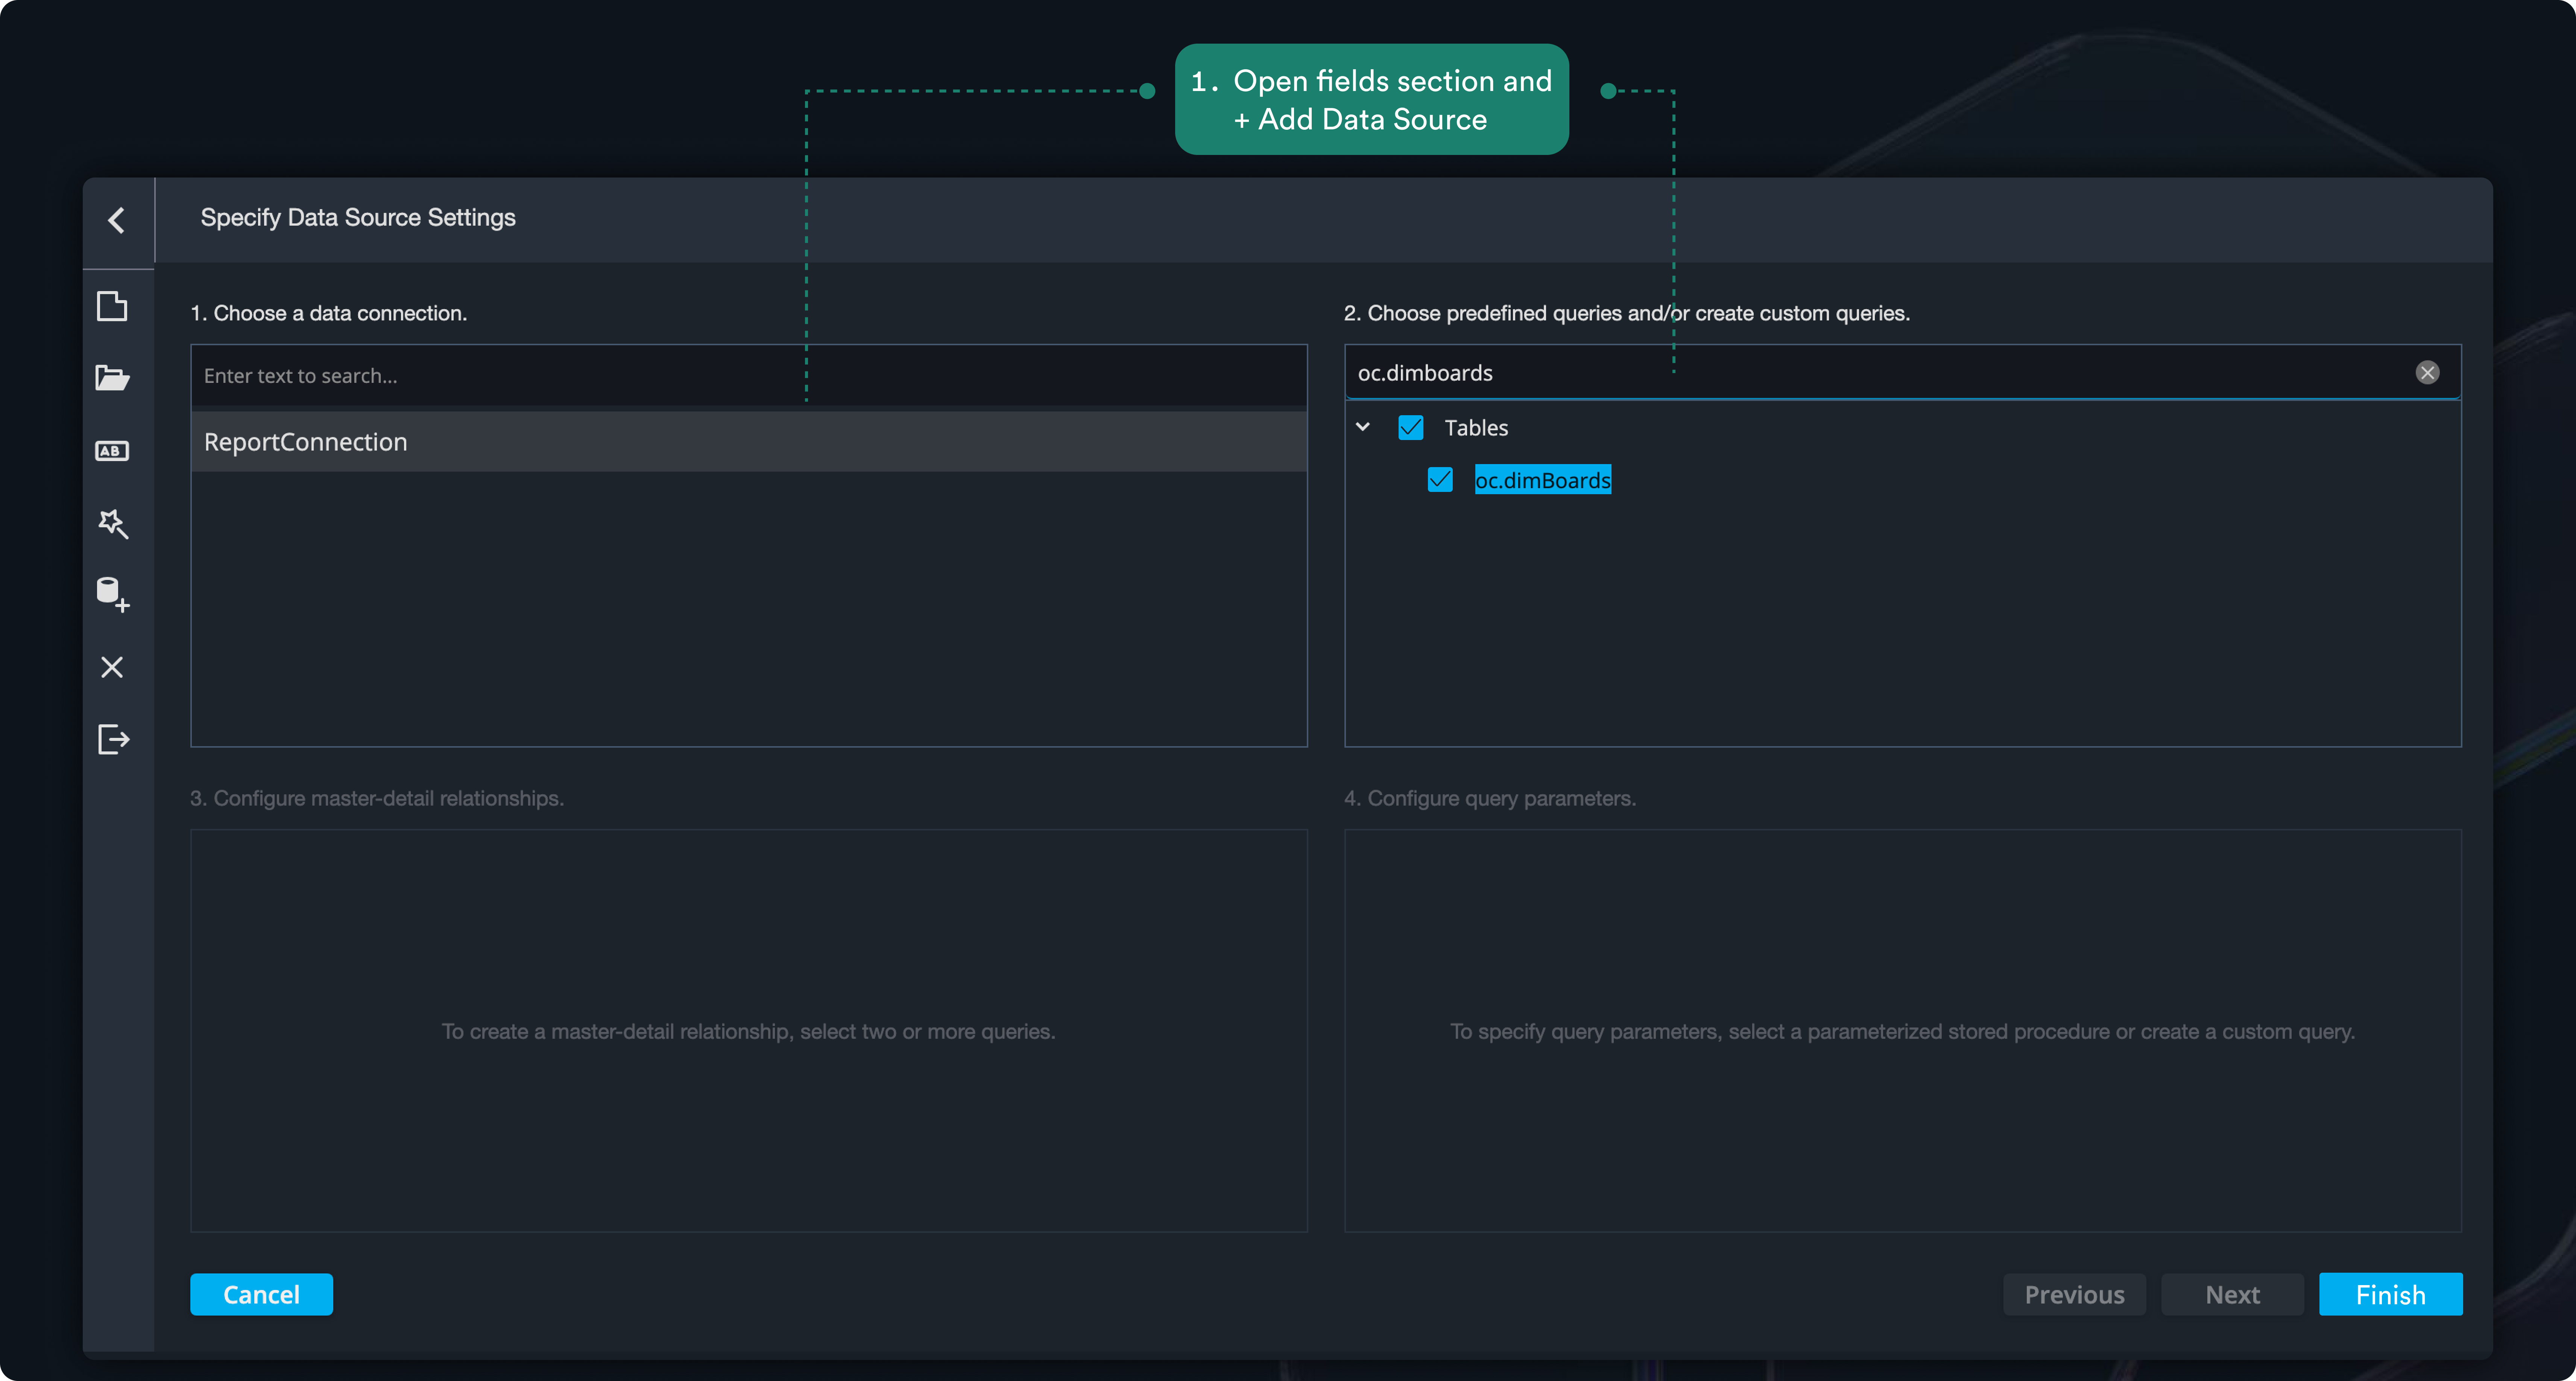
3. Click 'finish' at the bottom right to close the wizard.
By using the wizard, the connection to your data source is set up automatically, giving your report access to the tables you need. This ensures your report can display the correct data without extra configuration.
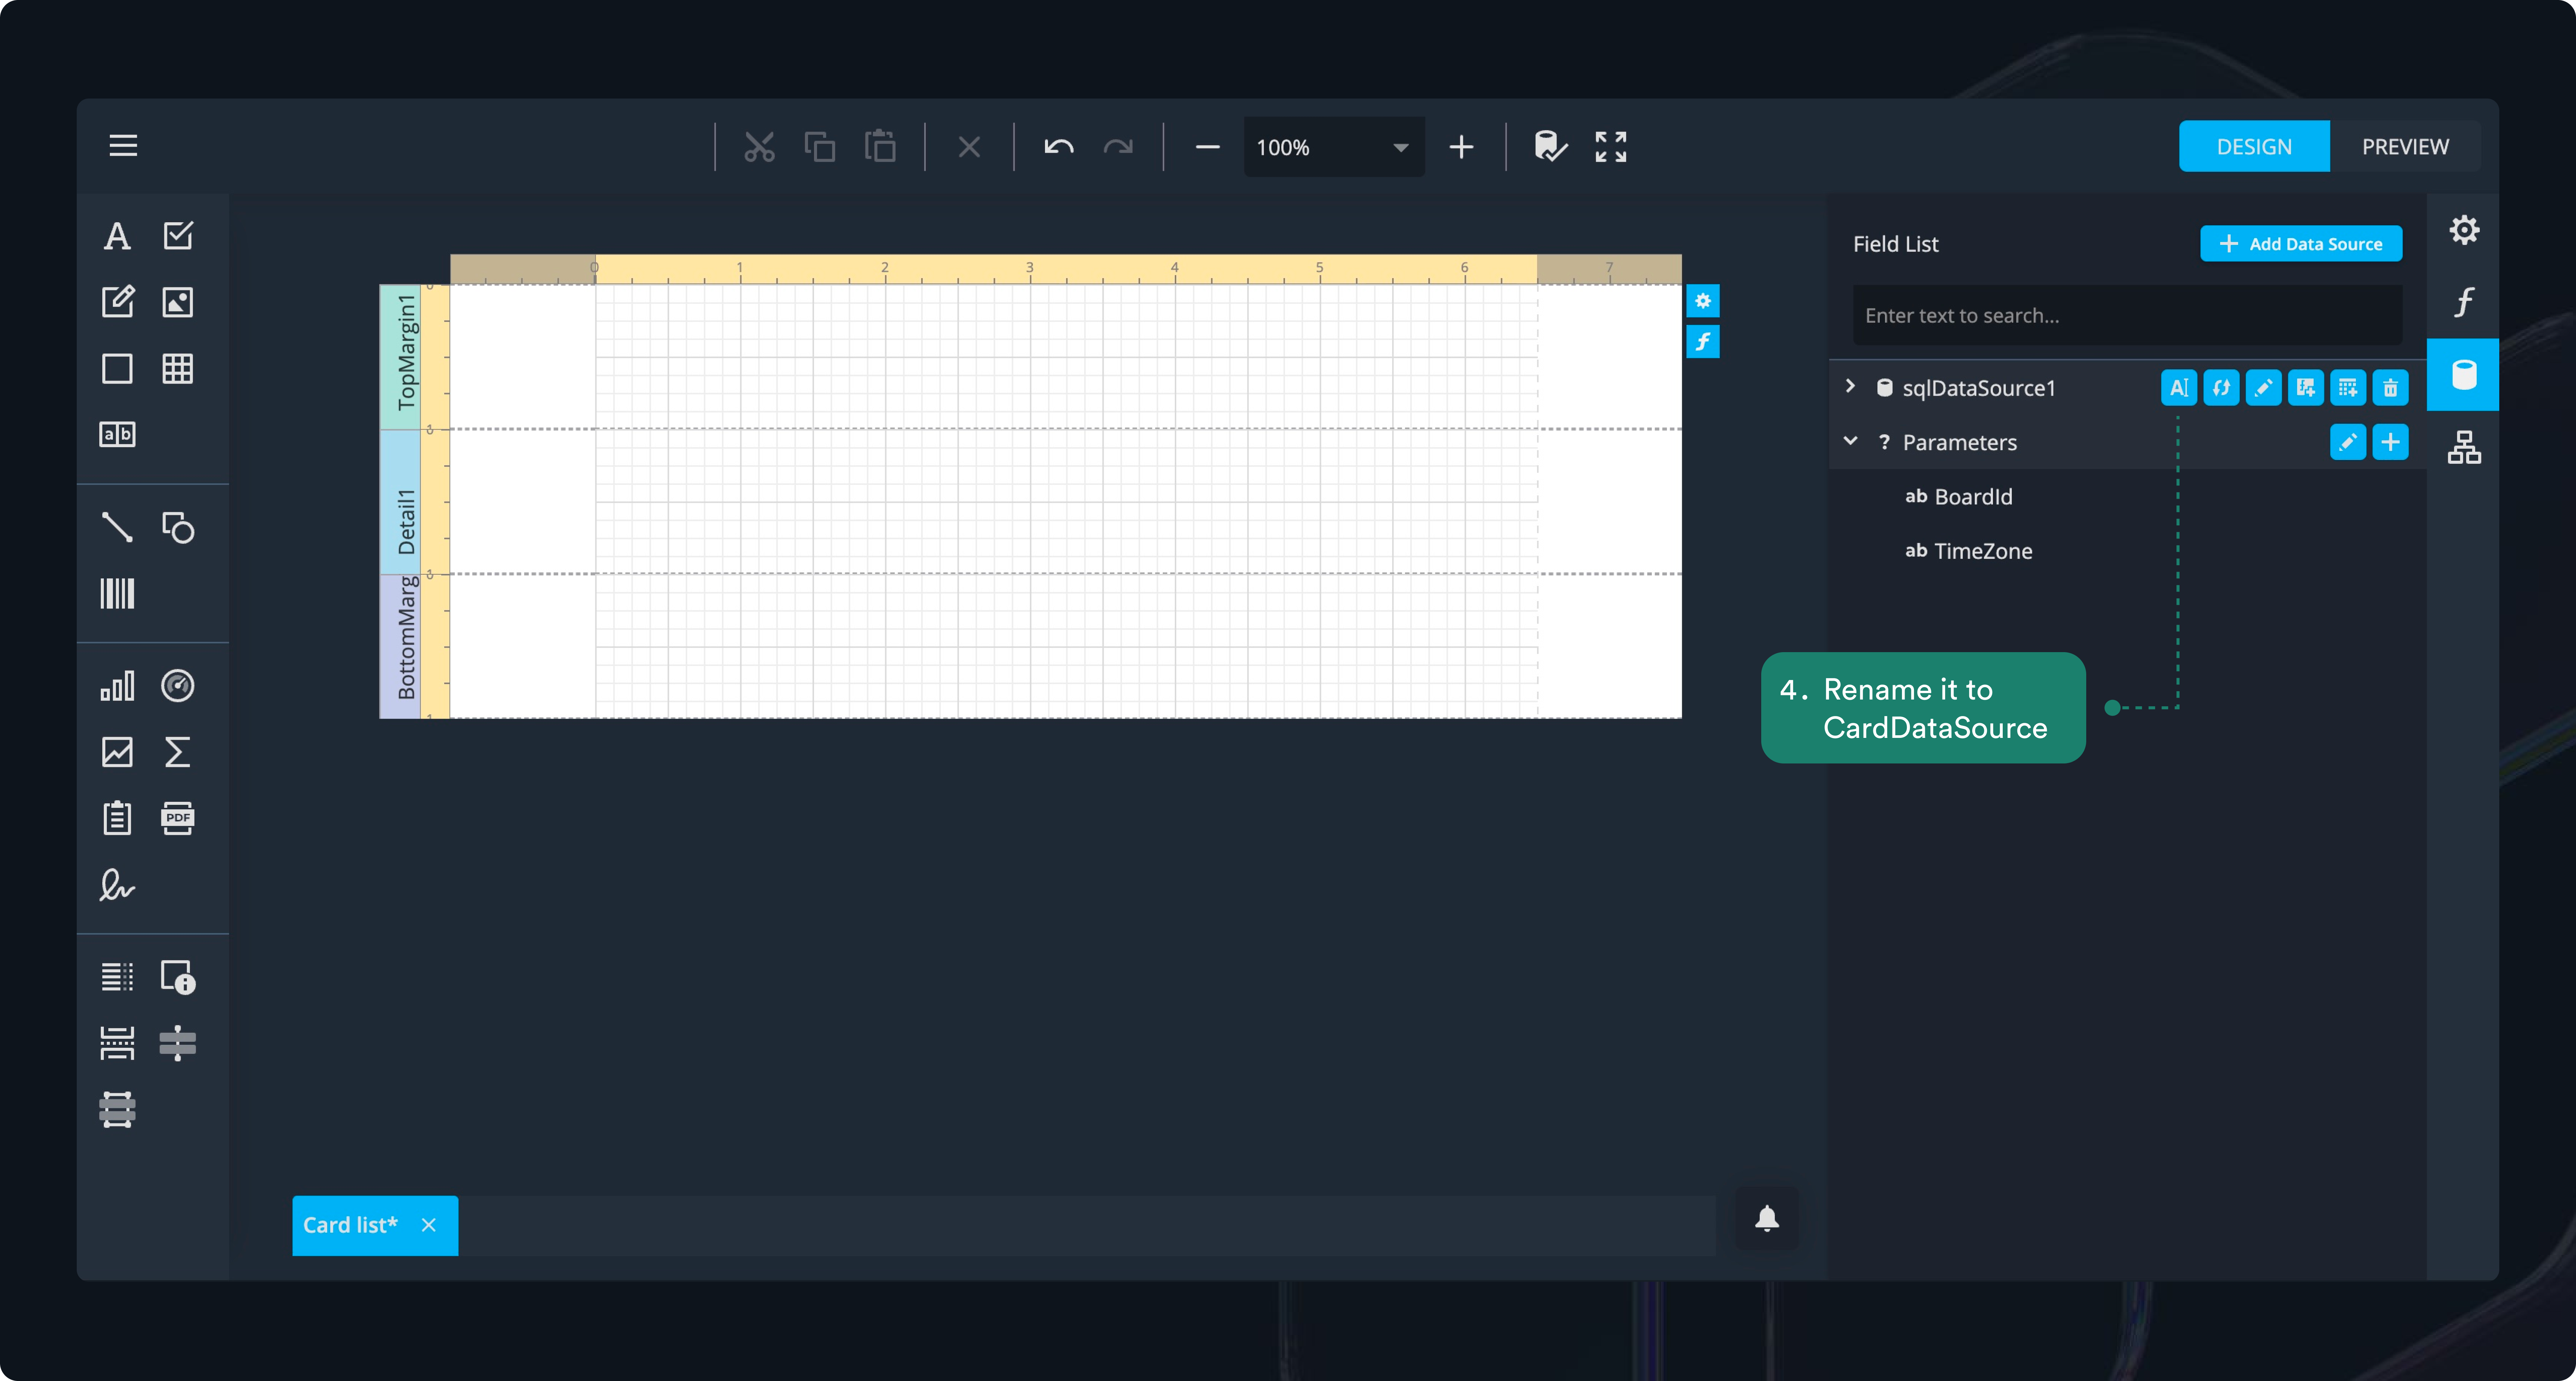
4. rename your data source
The wizard just added your first data source. To make it easier to recognize later, let’s give it a meaningful name.
- In the side panel, hover over sqlDataSource1 to reveal more options.
- Click Rename and change the name to CardDataSource.
- Press Enter to confirm.
- Click Apply changes to save.
Renaming your data sources early helps keep everything organized, especially as your reports grow more complex.
Understanding data sources and queries
A data source is the foundation of your report. It can contain one or more queries, and each query defines what data your report will use.
A query can include one or more tables or views.
Sometimes, instead of building a query yourself, you can use a stored procedure. These are predefined queries provided by Operations Center to make things easier.
For example, there are stored procedures for card layout and resource layout. These bring together all the necessary information about your work items or resources without you having to manually join multiple tables.
Think of stored procedures as shortcuts: they save you time and reduce complexity, especially when the data would otherwise be difficult to pull together on your own.
Selecting fields from the boards table
Now that your data source is set up, it’s time to choose which fields from the boards table you want to include in your report.
- In the side panel, click the arrow next to your data source to reveal oc_dimBoards.
- Hover over oc_dimBoards and select Edit query.
This will open the query editor, where you can specify the exact fields you need—keeping your report focused and avoiding unnecessary data.
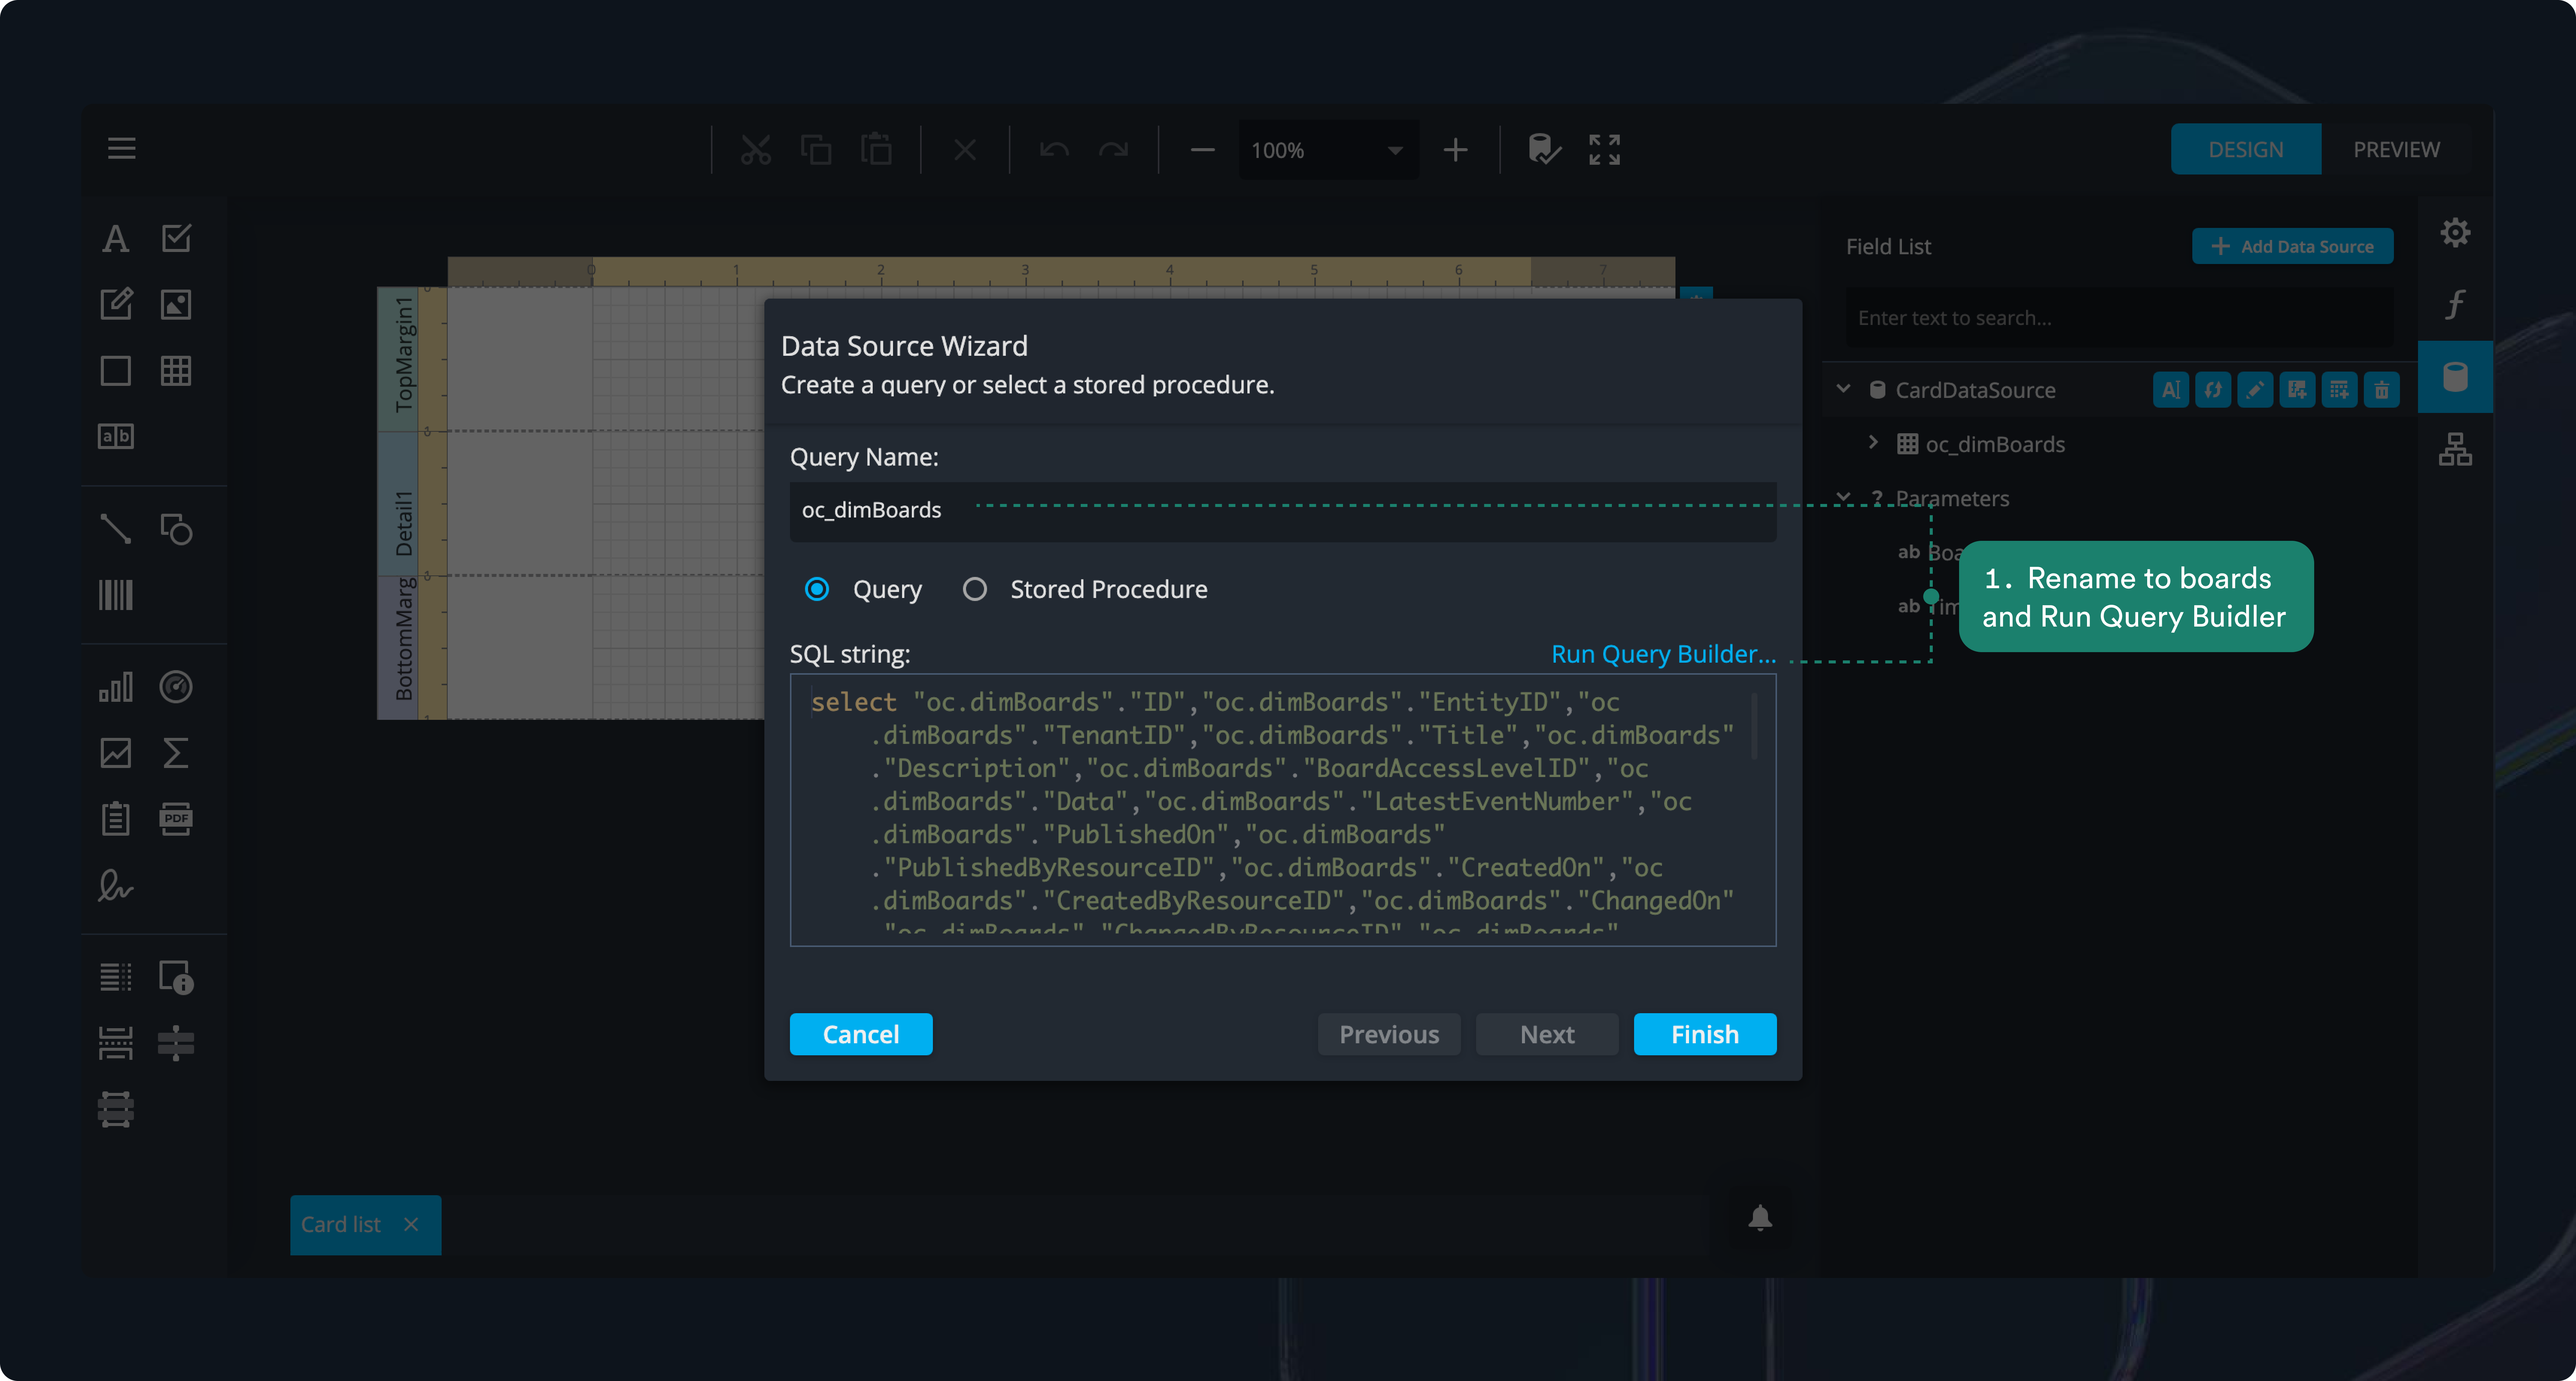
1. Edit the query
When you select Edit query, the Data Source Wizard opens. Here you’ll see the Query Name and the automatically generated SQL statement.
- Change the query name to Boards.
- Click Run Query Builder… to open the query builder popup.
The query builder gives you a simple interface to pick only the fields you need, without worrying about the SQL details behind the scenes.
2. Set an alias for your table
In the query builder, you’ll see the oc.DimBoards table on the left side. Click on it to open the Table Properties in the side panel.
In the Alias field, type Boards.
Database tables often use long technical names like oc.DimBoards (where oc is the schema and Dim is a prefix for “dimension”). By setting an alias, we make the name shorter and easier to work with. From now on, whenever we use Boards in this data source, it will refer to the original oc.DimBoards table.
3: Select the boardId field
In the query builder, uncheck the box next to Boards (this removes the “select all” option).
Then, check only the box next to ID.
- Click on ID to open its Column Properties in the side panel. In the Alias field, type BoardID.
This alias makes the field easier to understand in your report—so instead of seeing just ID, you’ll know it specifically refers to the Board ID from the Boards table.
Do the same for Title and Description.
4. Add the tenants table
- Inside the query builder, open the Available Tables and Views section in the side panel.
Use the search box to find dimTenants, then double click to select it.
Because the database is normalized, related information (like tenant details) is stored in separate tables. Adding dimTenants ensures your report can reference tenant information while keeping the underlying data relationships intact. The query automatically handles these relationships, so you don’t need to manually join tables.
- Click on OC.DIMTENANTS in the query builder.In the Table Properties section of the side panel, type Tenants in the Alias field.
This alias makes it easier to reference the table in your report. Instead of seeing the full table name, you’ll see Tenants, which is more readable and intuitive when building queries or displaying fields.
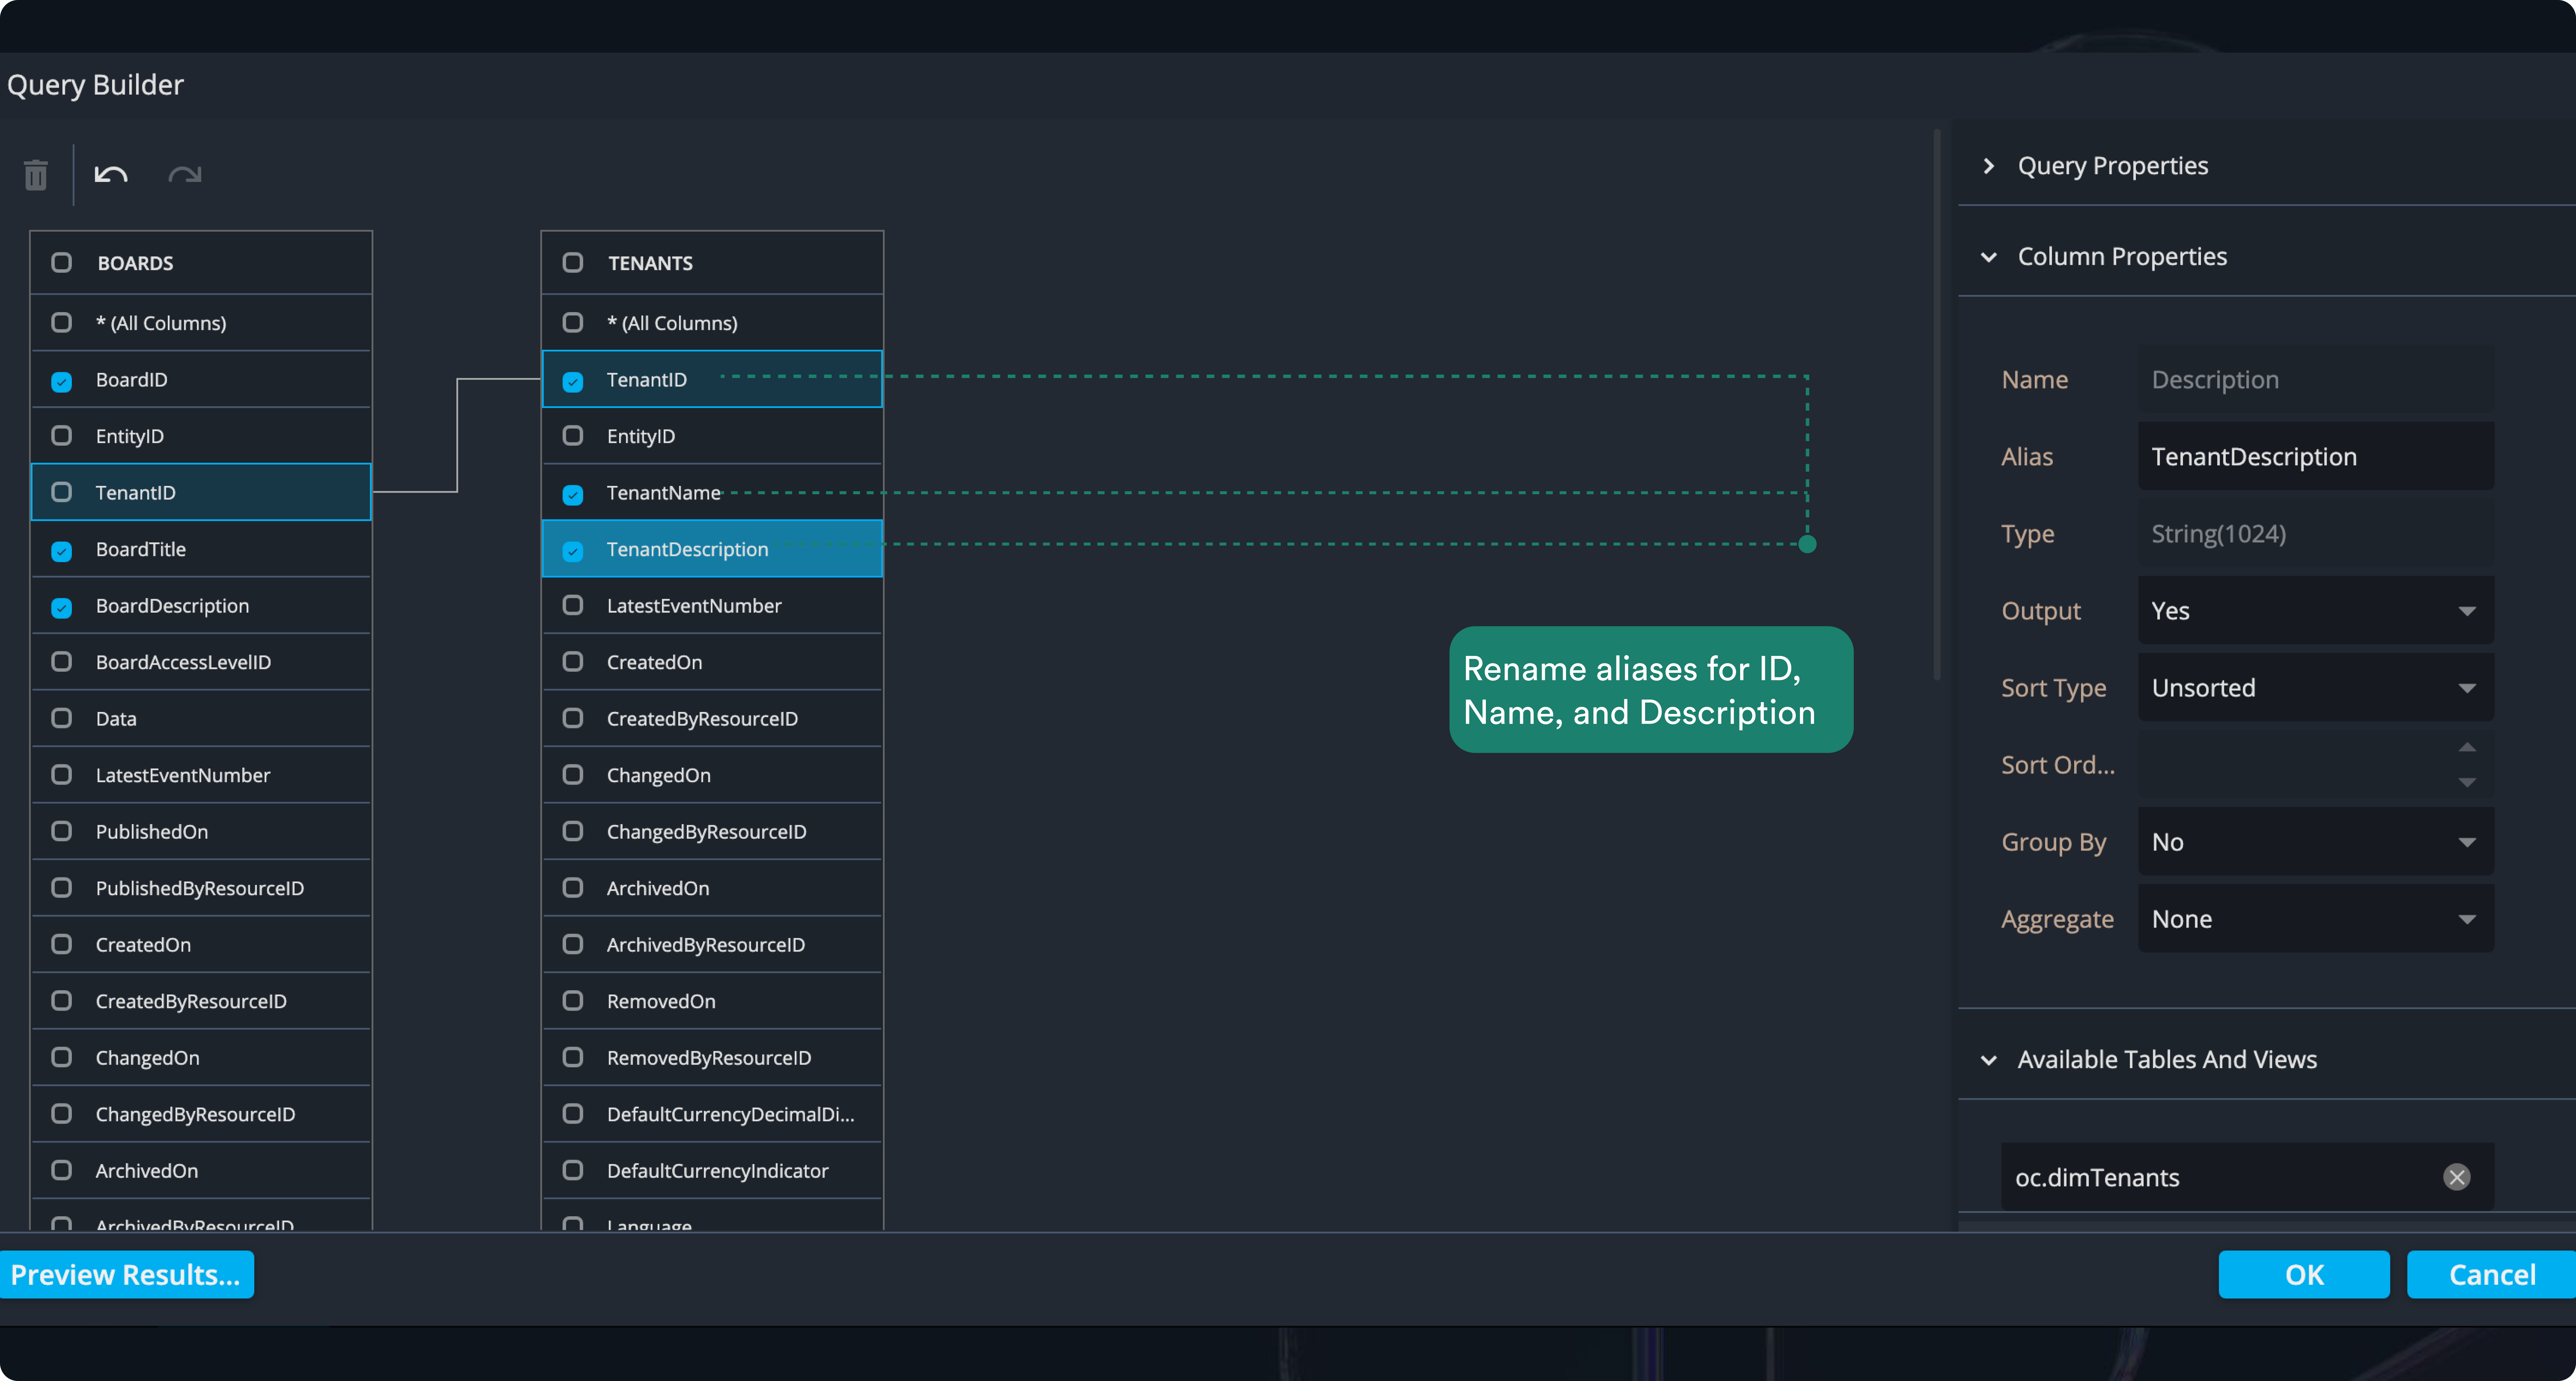
- In the Tenants table:
- Check the box next to ID and set the alias to TenantID
- Check the box next to Name and set the alias to TenantName
- Check the box next to Description and set the alias to TenantDescription
Using aliases makes it easier to understand which data each field represents when building your report, and keeps your queries and output clear and consistent.
5. Add a board filter parameter
In the query builder, scroll down to the Parameters section in the side panel (just below where you found the Tenants table).
- Click the plus (+) button to create a new query parameter.
- Expand the arrow next to Parameter1 to reveal its properties.
- Change the name to BoardID.
Adding this parameter ensures the report only retrieves data related to the specific board the user is currently viewing. Since a tenant can have multiple boards, this filter prevents unrelated board data from appearing in the report. The BoardID is automatically provided, so it applies the filter without extra manual steps.
Next, you need to set the parameter type and result
- In the BoardID parameter properties, change the Type to Expression.
Note: you may need to scroll down in the dropdown to find the Expression option.
- Open Result Type and select Number (32-bit integer).
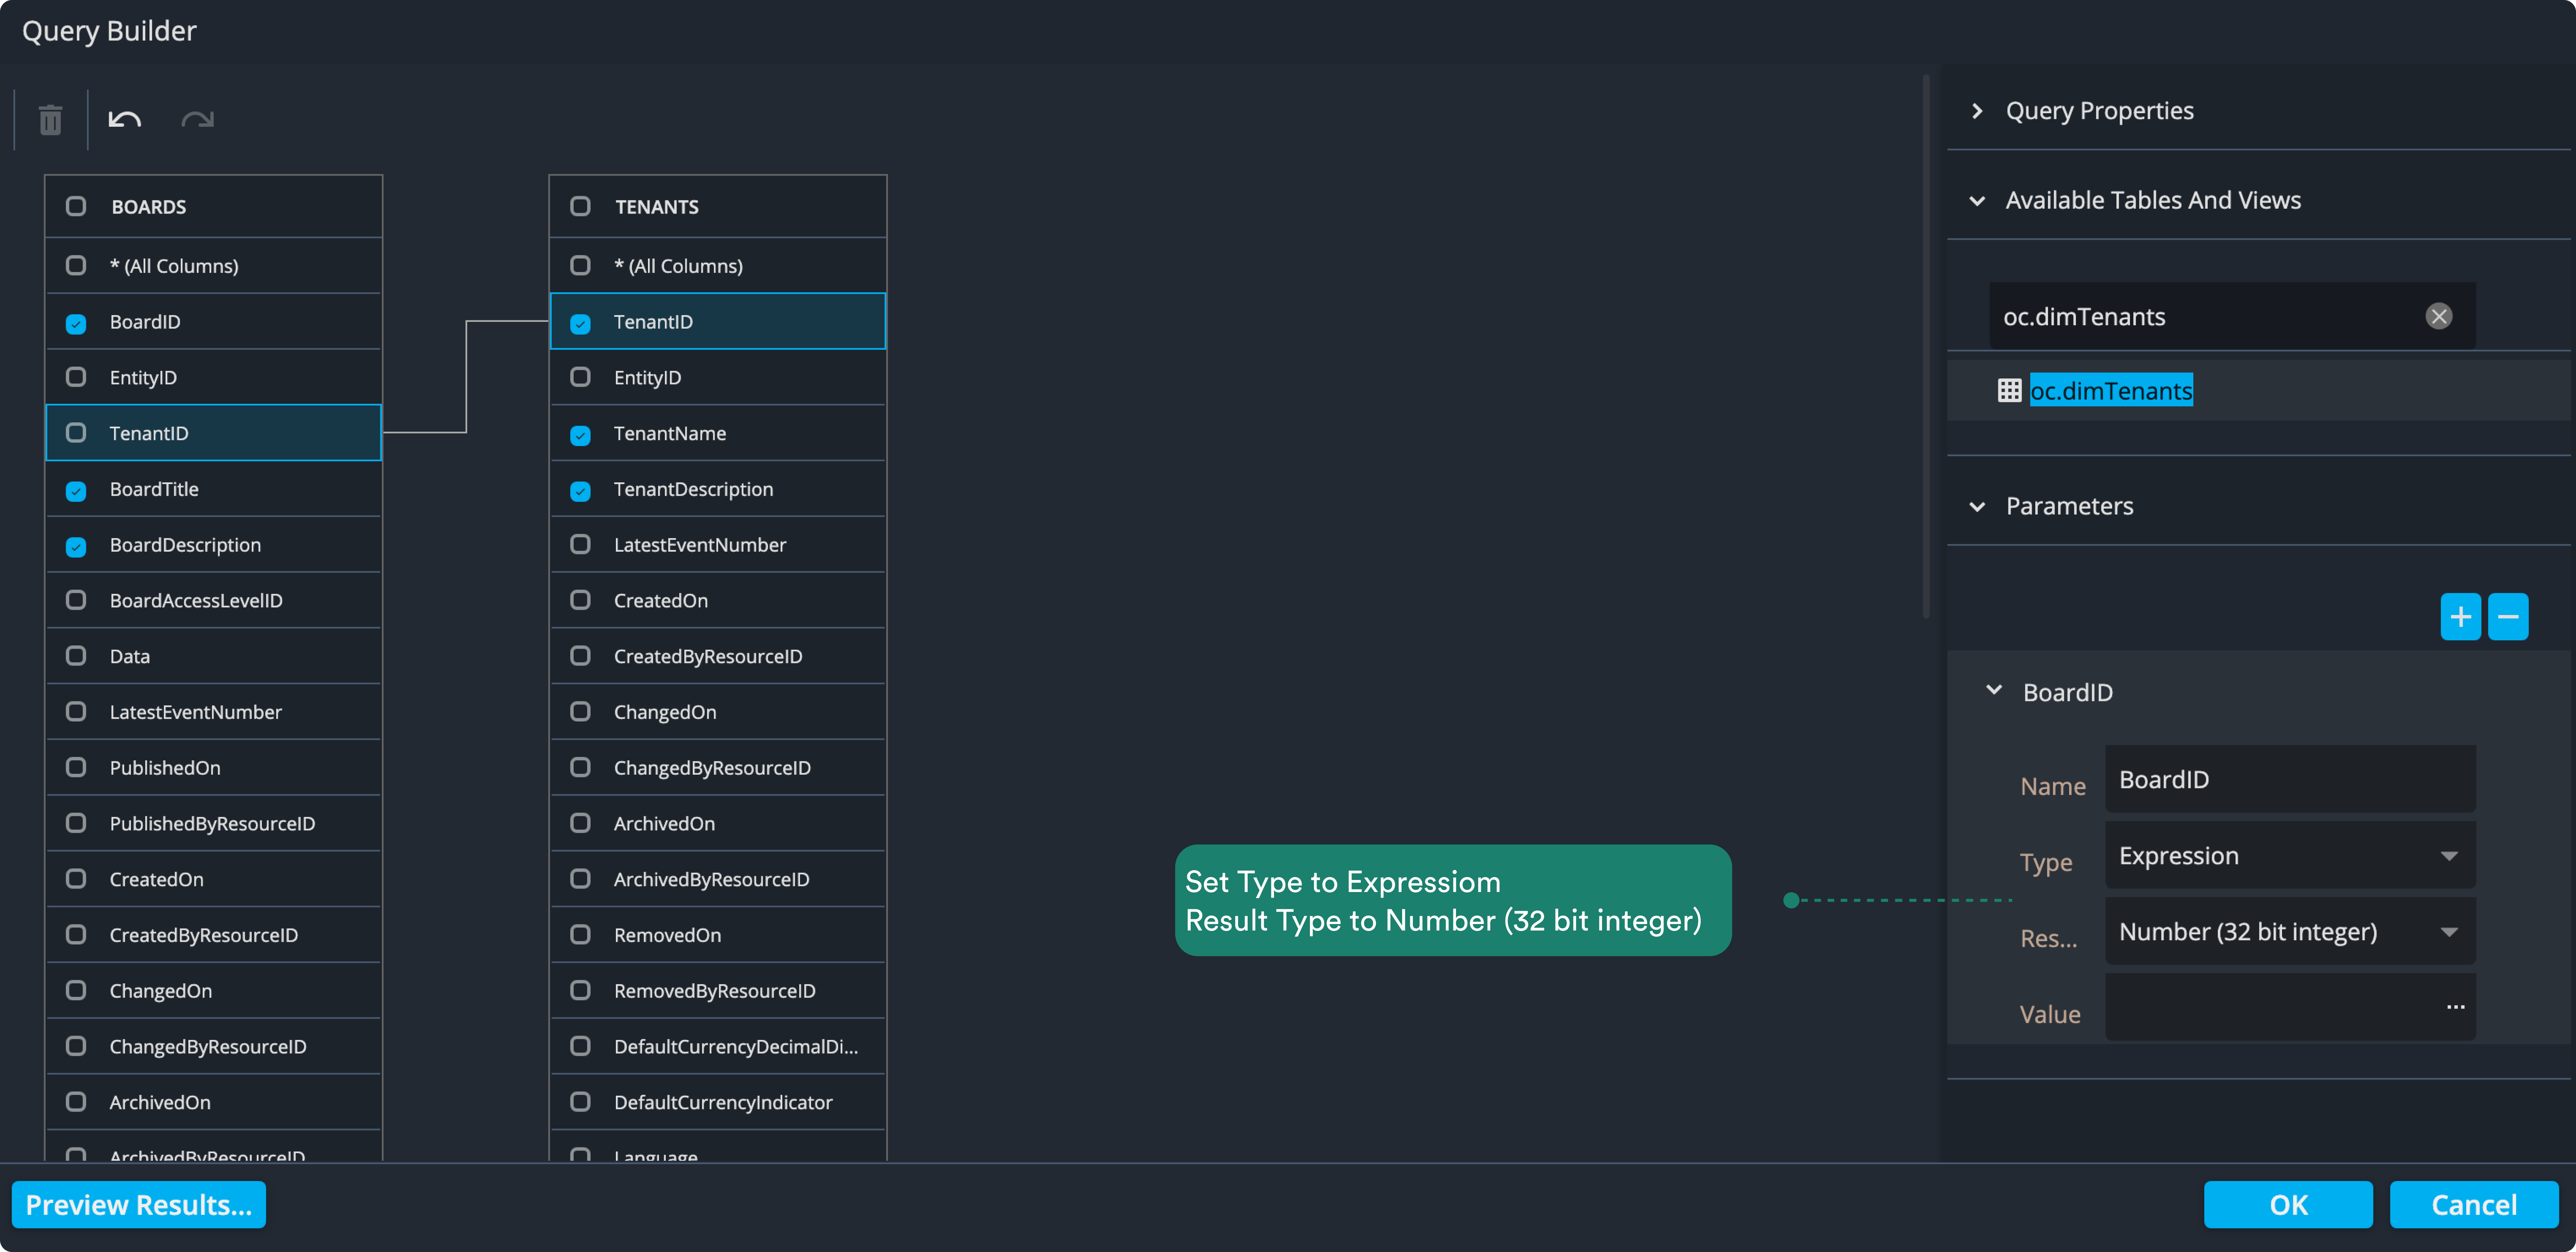
This ensures the parameter can accept the numeric board ID automatically provided by the system. By setting it as an expression and specifying the result type, the report can properly filter data for the current board without errors.
6. Assign the report parameter to the query
- Click the three dots next to the Value field to open the Expression Editor.
- Expand the Parameters item to see the report parameters automatically provided by Operations Center.
- Double-click BoardId to add it to the expression at the top, then click OK to close the editor.
- The value is now assigned to the query parameter, indicated by a question mark (?) before the parameter name.
This step ensures the query uses the current board’s ID when fetching data. By linking the report parameter to the query, the report automatically filters results so only information relevant to the board the user is viewing is displayed.

7. Filter the data using the BoardId parameter
Hover over the And in the filter area. A plus (+) button will appear.
- Click the plus button and select Add condition. This adds an empty condition to your filter.
- Click the blue empty button, search for ID, and select it.
- Click the arrow on the grey box labeled “Enter a value” and choose Parameter. Select the BoardId parameter we created earlier.
- Click OK to close the filter editor.
The filter is now complete. This ensures that the query only retrieves data related to the current board, rather than all boards in the system.
- Click OK to close the Query Builder. You should now see the corresponding SQL string.
- Select Finish to close the wizard.
By completing this step, your report data is automatically scoped to the board the user is viewing, ensuring relevant and accurate results.